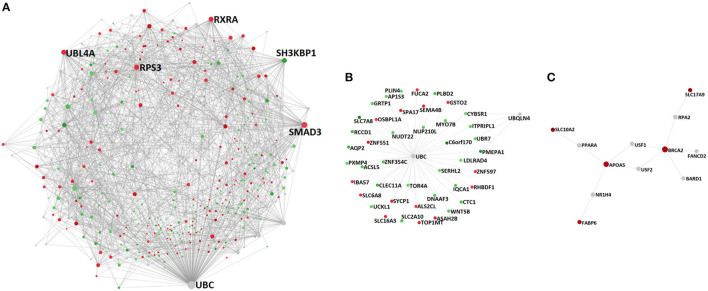
Figure 4.
PPI networks constructed upon the genes associated with differentially methylated promoters between non-diseased aortic and mitral valve tissue and the proteins that are necessary to interconnect them: (A) complete network, (B) subnetwork 1 (p-value 3.04e-13) and (C) subnetwork 2 (p-value 0.047). Depicted nodes are classified according to their methylation direction: nodes representing genes showing increased methylation in mitral compared to aortic tissue (red), nodes depicting increased methylation in aortic vs. mitral tissue (green) and nodes representing genes that are not part of the input dataset (gray). Node sizes are proportional to their betweenness centrality values. Betweenness centrality reflects the number of shortest paths passing through a node, while degree refers to the number of connections/edges/PPIs that a node has to other nodes. Hub nodes (A) UBC, SMAD3, UBL4A, RPS3, RXRA, (B) UBC and (C) BRCA2 and APOA5 can be clearly identified on the respective networks.

