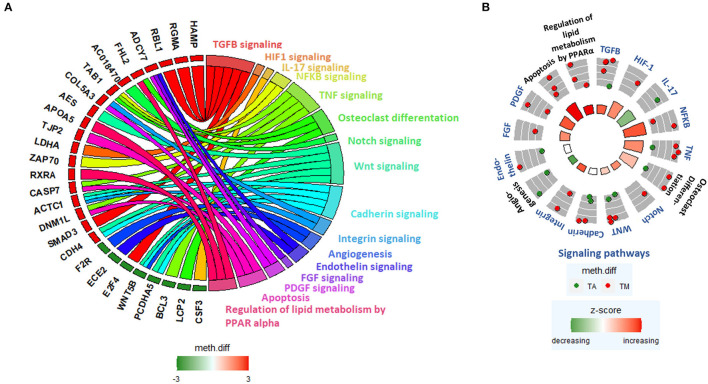
Figure 5.
(A) GOChord plot linking selected pathways to their constituent genes, which are associated with DM promoters. Green-to-red colors next to the selected genes reflect their meth.diff values. (B) GOCircle plot representing the relevant pathways and their constituent genes that are associated with DM promoters. The inner circle consists of bar plots, whose heights reflect the significance of the pathway and whose color reflect the z-score, which approximates the overall direction of change in methylation for each pathway. The outer circle shows scatterplots of the meth.diff values of each of the pathway's constituent genes.

