FIGURE 4.
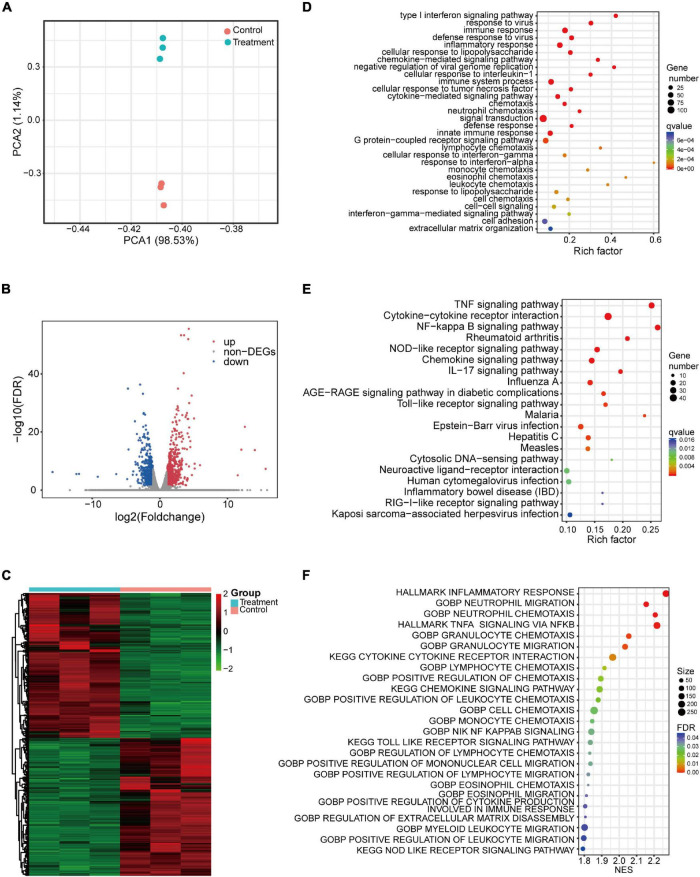
Transcriptomic analysis of THP-1 macrophages exposed to IL-26. (A) Principal component analysis of protein-coding genes. (B) Volcano plots showing protein-coding genes from untreated and IL-26-treated macrophages, red and blue indicate the significantly upregulated and downregulated genes, respectively. (C) Heatmap of differentially expressed protein-coding genes between untreated and IL-26-treated macrophages. (D) GO enrichment analysis (biological process) of up-regulated genes. (E) Top 20 from the KEGG enrichment analysis of up-regulated genes ranked by q-value. (F) GSEA analysis of all protein-coding genes in IL-26-treated macrophages.

