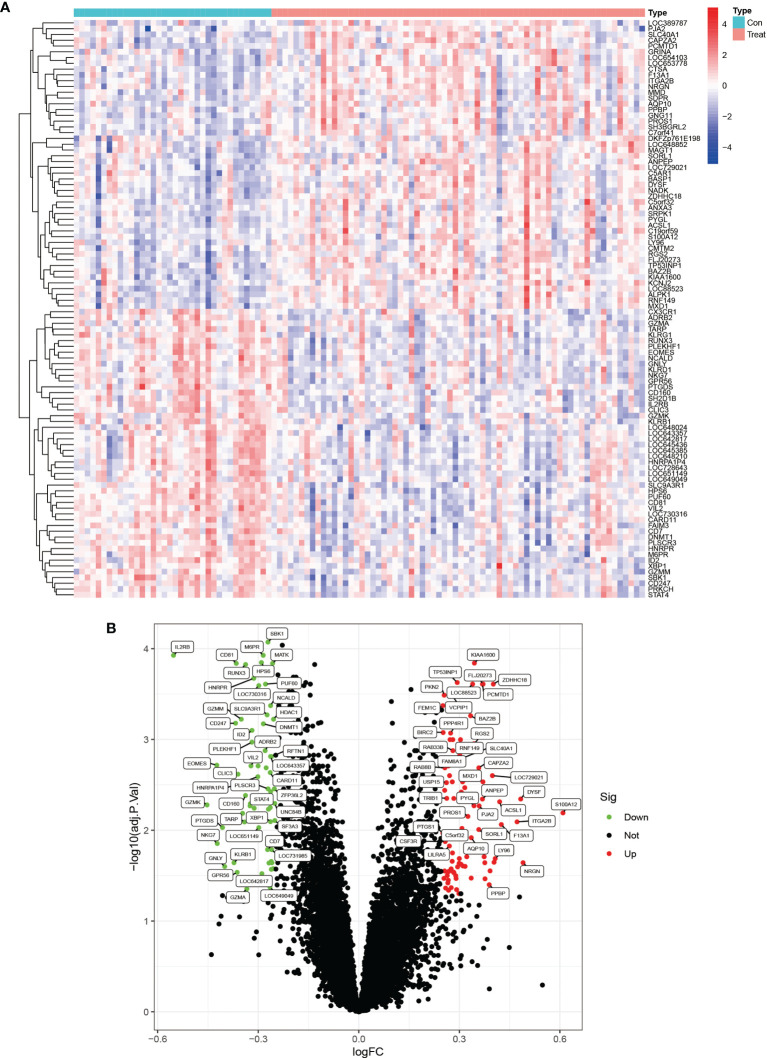
Figure 1.
Heat map and volcano plots of differentially expressed genes. (A) shows the heat map of differentially expressed genes, red indicates high expression genes and blue indicates low expression genes. (B) shows the volcano plots of differentially expressed genes, red is for high expression genes and green is for low expression genes.

