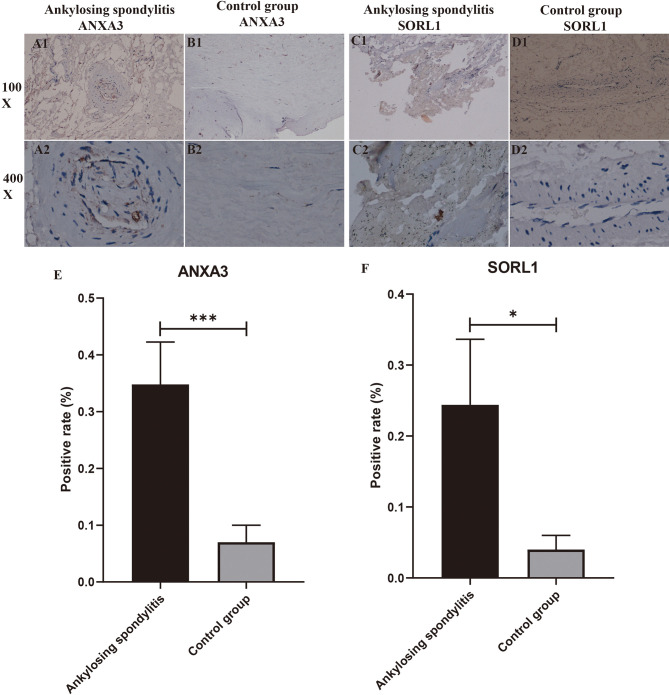
Figure 10.
Immunohistochemistry and positive rate statistics. (A1-D2) show the specific expression of ANXA3 with SORL1 in AS and controls. (E, F) shows the positive rate statistics of all immunohistochemical images of SORL1 in AS and control groups. “*” indicates p < 0.05, “***” indicates p < 0.001.

