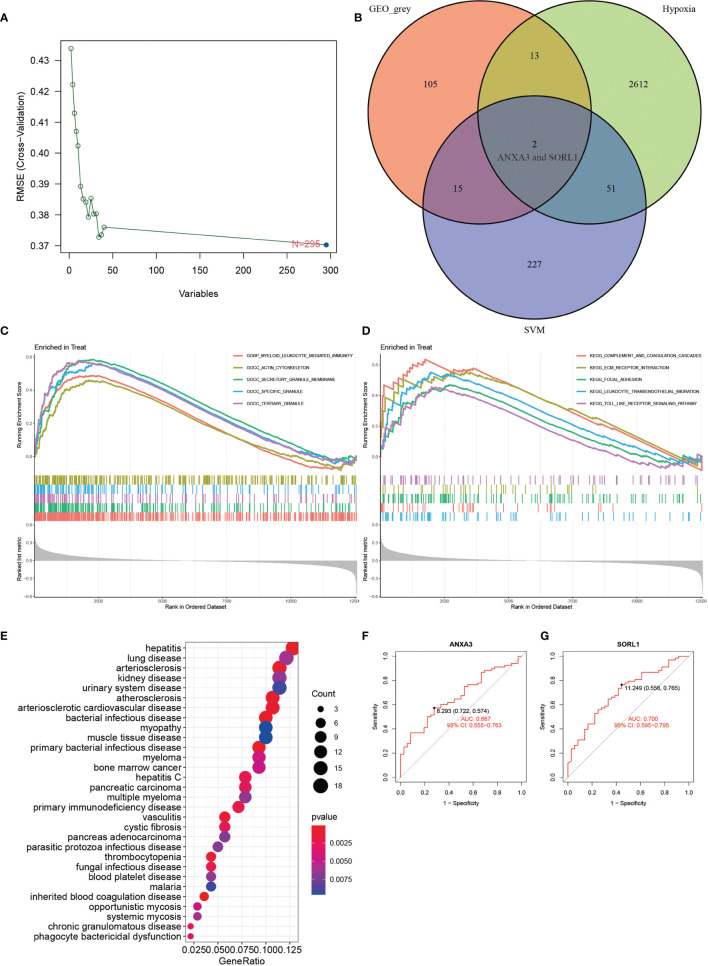
Figure 3.
SVM analysis, GSEA, DO analysis, veen plot and ROC curve. (A) shows the results of SVM analysis. (B) shows the results of intersection of GEO_grey module, hypoxia-related genes and SVM analysis. (C, D) show the results of GO and KEGG from GSEA enrichment analysis. (E) shows the results of DO enrichment analysis. (F, G) show the ROC diagnostic curves of 2 genes of the model. (F, G) show the ROC curves of 2 genes of the model.

