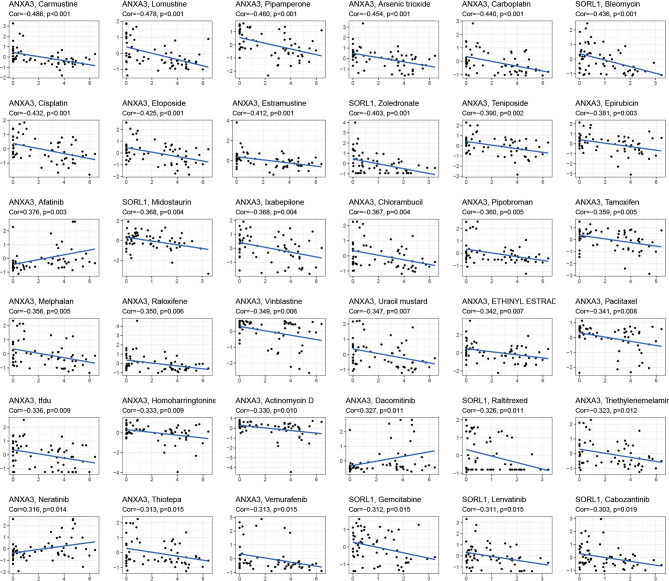
Figure 5.
Drug sensitivity analysis. The graph shows the drug sensitivity analysis of ANXA3 and SORL1 with various drugs. If Cor > 0, it means the gene is positively correlated with drug sensitivity, the higher the gene expression, the stronger the sensitivity of this drug; conversely, Cor < 0 means the gene is negatively correlated with drug sensitivity, the higher the gene expression, the worse the sensitivity of this drug.

