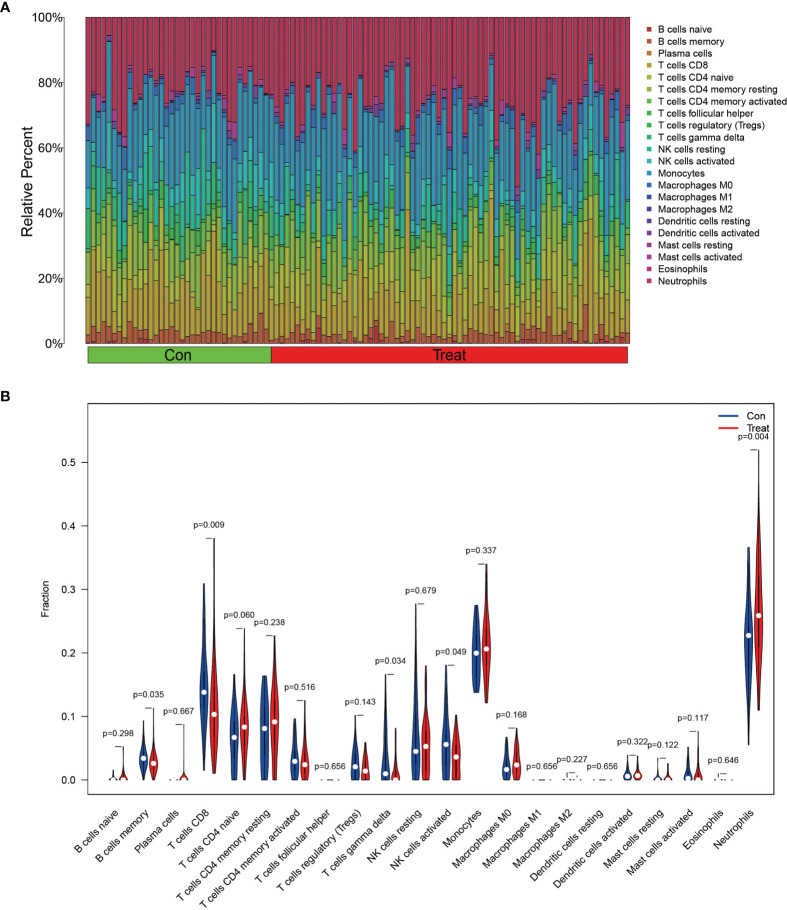
Figure 6.
Immune cell composition analysis and differential expression analysis of immune cells. (A) shows the immune cell composition of all GEO downloaded samples, each sample consists of 22 immune cells with a total ratio of 100%. (B) shows the differences in immune cells in AS and control group, as seen in Neutrophils, NK cells activated, T cells gamma delta, T cells CD8 and B cells memory were significantly different (p < 0.05).

