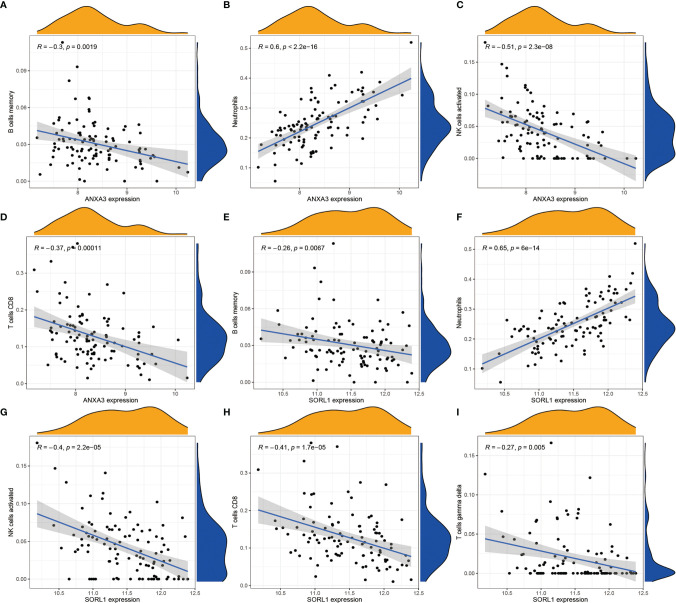
Figure 7.
Correlation analysis of ANXA3, SORL1 and immune cells respectively. (A-D) shows the correlation analysis of ANXA3 and 4 immune cells. (E-I) shows the correlation analysis of SORL1 and 5 immune cells. If R > 0, it means higher gene expression and higher immune cell content; if R < 0, it means higher gene expression and lower immune cell content.

