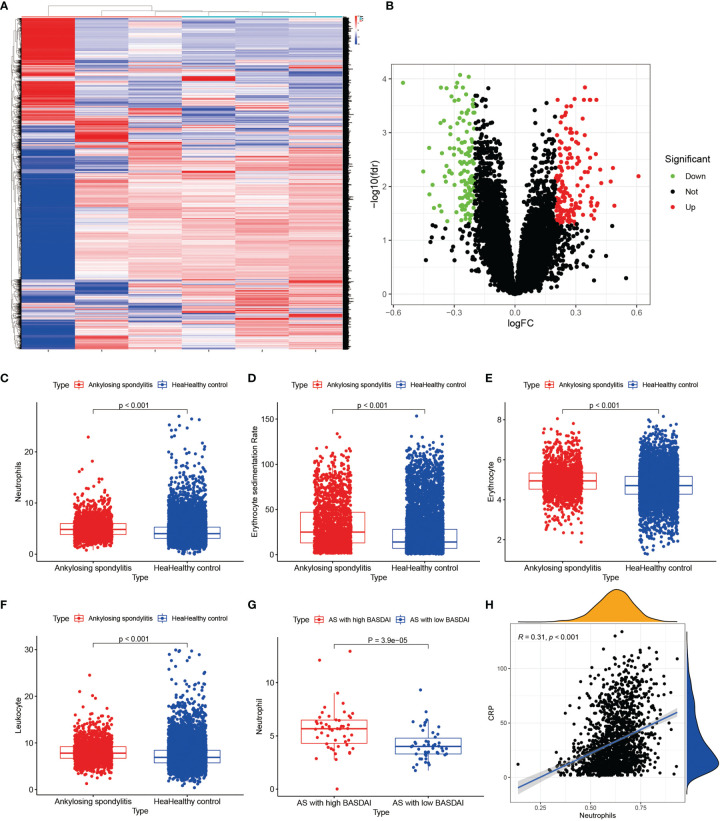
Figure 9.
Results of external validation sets are shown. (A, B) show heat and volcano maps of differentially expressed genes measured by high-throughput sequencing, confirming that ANXA3 and SORL1 are also differentially expressed genes in the interspinous ligament of AS. (C-F) show the variance analysis of the routine blood tests. (G) shows the difference in neutrophils between high BASDAI cases and low BASDAI cases. (H) shows the relationship between neutrophils and CRP.

