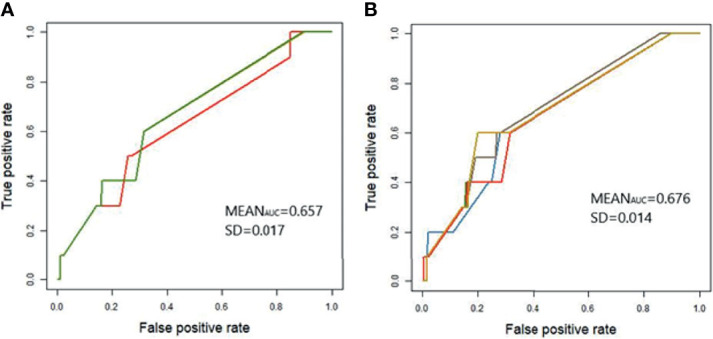
Figure 2.

Receiver Operating Characteristics (ROC) curve for application of genomic predictions from the study population to the validation population. GBLUP models were developed using the 142 (A) and 40 (B) SNPs with evidence of association with the case-control population 1; P < 5 × 10⁻⁵ and P < 5 × 10⁻⁷, respectively. Genetic predictions were cross-validated in the validation population using a five-fold strategy as described in Materials and Methods. Each curve represents one of the five generated models and models might occasionally overlap. The average AUC and standard deviation (SD) across the five cross-validations are included in each figure.
