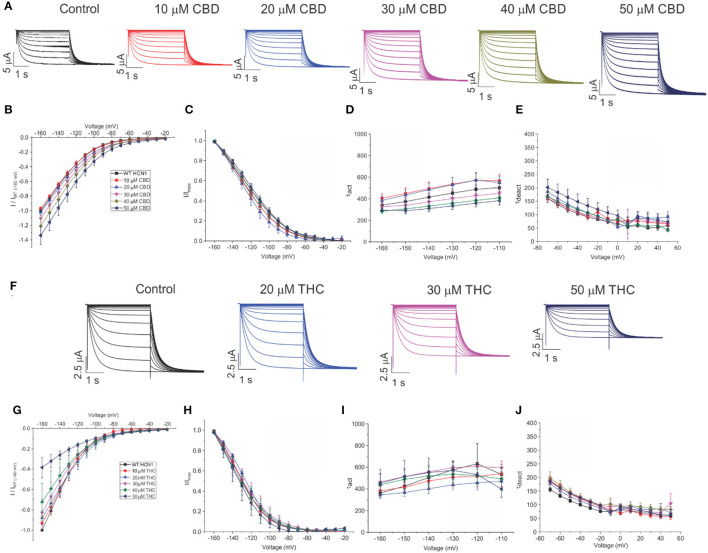
Figure 3.
Regulation of HCN1 by cannabidiol (CBD) and Δ9-tetrahydrocannabidiol (THC). (A) Representative traces from a paired experiment following the addition of increasing concentrations of CBD to oocytes expressing full-length HCN1. (B) Current–voltage (I/V) relationship in presence of CBD normalized to maximal current (IWT(−160mV)) (5 < n <18 per condition; P < 0.05 for 30–50 μM). (C) Steady state activation in presence of CBD (P = 0.81 for V1/2). (D) Activation time constant (τ) kinetics in presence of CBD (0.21 < P < 0.71). (E) Deactivation time constant (τ) kinetics in presence of CBD (3 < n <7 per condition; 0.09 < P <0.65). (F) Representative traces from a paired experiment following the addition of increasing concentrations of THC to oocytes expressing full-length HCN1. (G) (I/V) relationship in presence of THC normalized to maximal current (IWT(−160mV)) (4 < n <8 per condition; P <0.05 for Gmax (slope between −120 and −160 mV) of 20–50 μM). (H) Steady-state activation in presence of THC (P = 0.49 for V1/2). (I) Activation time constant (τ) kinetics in presence of THC (0.21 < P < 0.90). (J) Deactivation time constant (τ) kinetics in presence of THC (3 < n < 8 per condition; 0.11 < P < 0.45).

