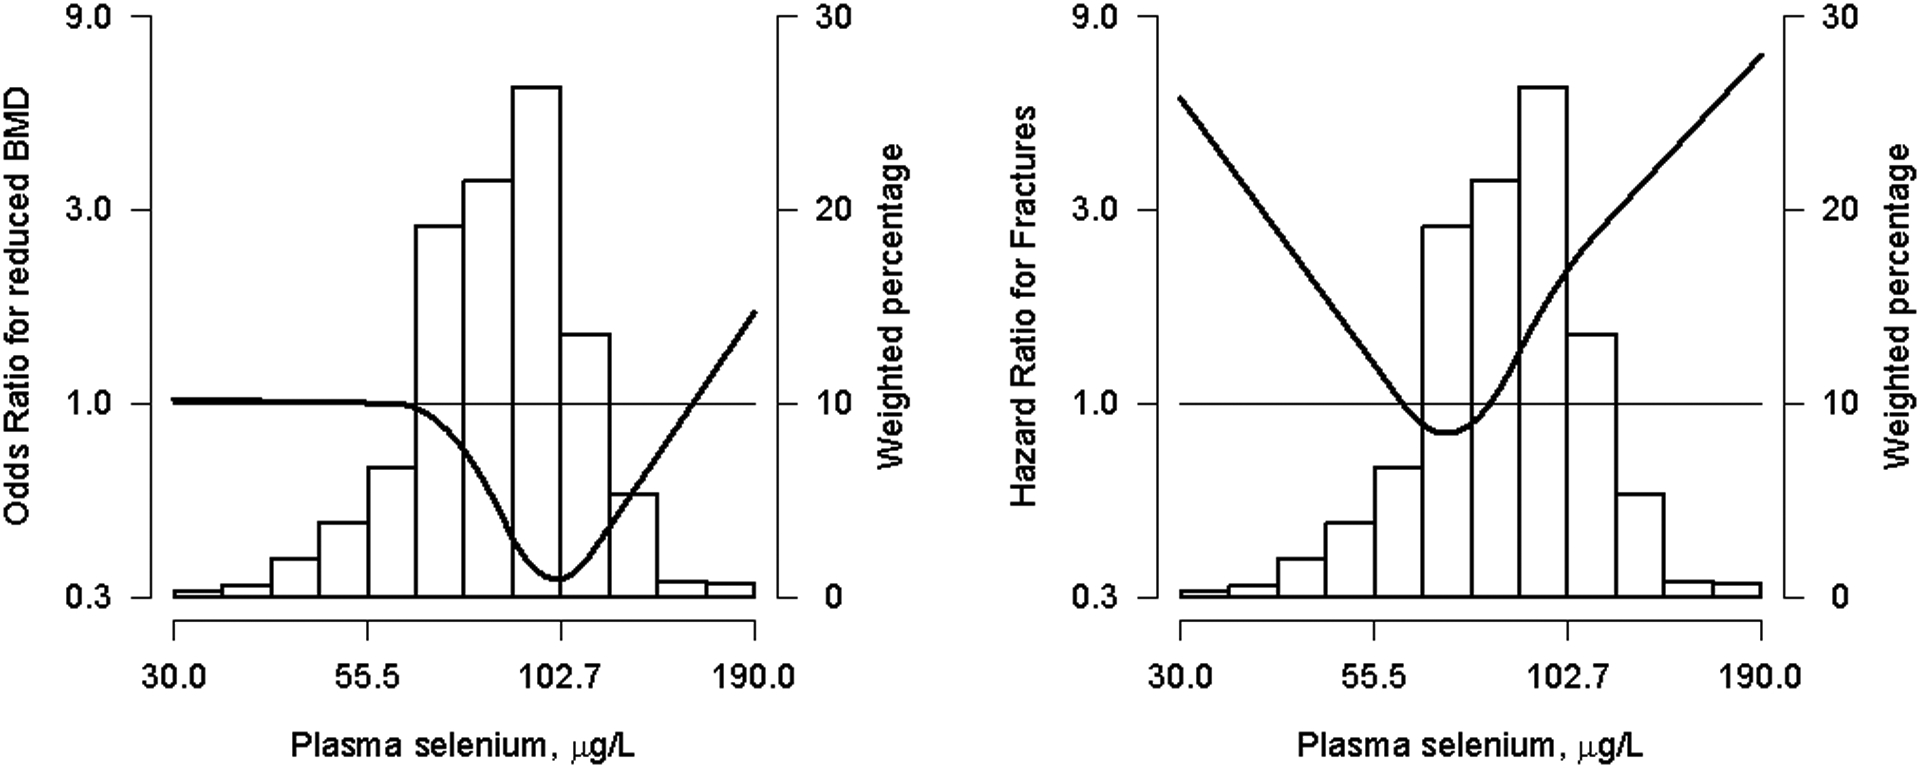
Figure 1. Odds ratio (95% CI) of reduced Bone Mineral Density and Hazard Ratio (95% CI) of Osteoporosis-Related Bone Fractures by plasma Se concentrations (μg/L) in the subsample of individuals older than 50 years (n= 702 and 638, for the cross-sectional and prospective analysis, respectively).

The curve (gray shades) represent the odds ratio (95% confidence interval) of reduced BMD levels (BMD below −1.0 SD) and hazard ratio (95% confidence interval) of osteoporosis-related fractures based on restricted quadratics splines with knots at the 10th, 50th and 90th percentiles of plasma Se distribution (29.92, 84.46 and 115 μg/L, respectively). The reference value was set at the 10th of plasma Se distribution (29.9 μg/L). Odds ratio and Hazard ratio were estimated with logistic and cox proportional hazards models, for the cross-sectional and prospective analysis, respectively. Models were adjusted for age, sex, education, body mass index, smoking status (never, former and current), cumultavie smoking (pack-years), urine cotinine levels (34, 34–500 y >500 ng/ml), alcohol intake (never, former and curent), glomerular filtration rate (ml/min/1.73m2) and physical activity (METs min/week). The histogram represents the frequency distribution of plasma Se in the study sample.
