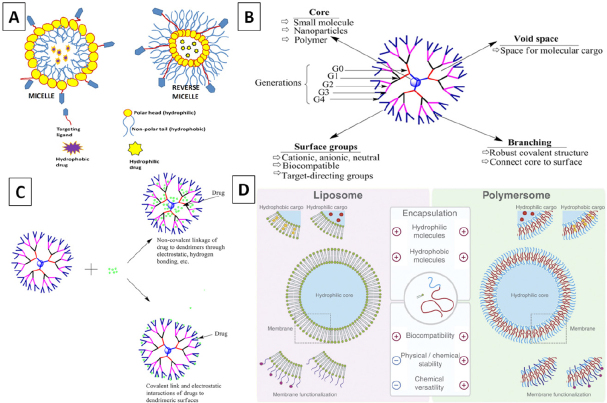
Figure 3.
Schematic representation of polymeric micelle and reverse polymeric micelle (Original figure) (A); Schematic representation of a dendrimer (B)[38]; Schematic representation of possible types of drug-dendrimer interactions (C)[38]; Schematic representation of liposomes (left) versus polymersomes (right) (D)[47]

