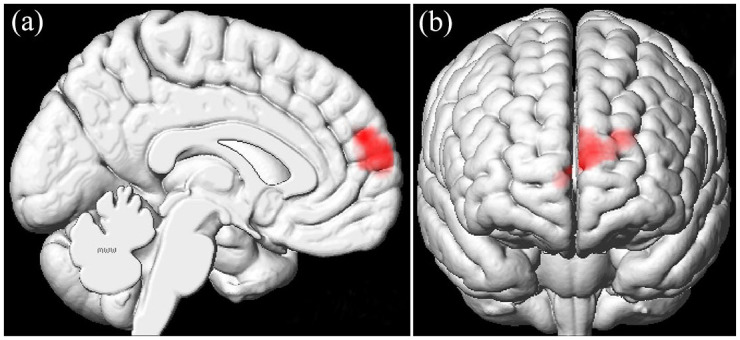
Figure 3.

Using 2 × 2 analysis of variance (ANOVA), significant interaction effect was detected in the left mPFC (BA10) (medial frontal gyrus) (peak MNI coordinate: –22.5, 57, 24; F values: 21.0359; cluster size: 1599). mPFC, medial prefrontal cortex.
