Figure 4.
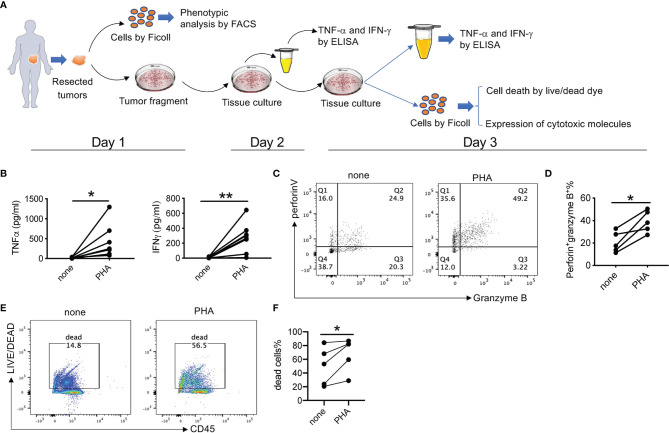
Ex vivo culture of clear cell renal cell carcinoma (ccRCC) tissue slices. (A) Schematic overview of the ex vivo culture model. Human tumor tissue was manually processed in tissue slices with a proportion for single-cell preparation. The tumor tissue slices were placed in a 24-well plate in the presence or absence of different stimuli or inhibitors for 3 days. The culture supernatant was collected on both day 2 and day 3 for cytokine secretion. On day 3, single-cell suspension was prepared and analyzed for cell death, proliferation, and cytotoxic capacity. (B) Summarized data about TNF-α and IFN-γ stimulated by phytohemagglutinin (PHA) from 8 patients. The experiment was performed in triplicate. Each line means one patient. (C) Representative fluorescence-activated cell sorting (FACS) plot showing expression levels of perforin and granzyme B (D) Summarized data about the frequency of perforin+ granzyme B+ CD8+ T cells (n = 5). (E) Representative FACS plot showing percentages of dead cells. (F) Summarized data about the percentages of dead cells (n = 5). *p < 0.05, **p < 0.01.

