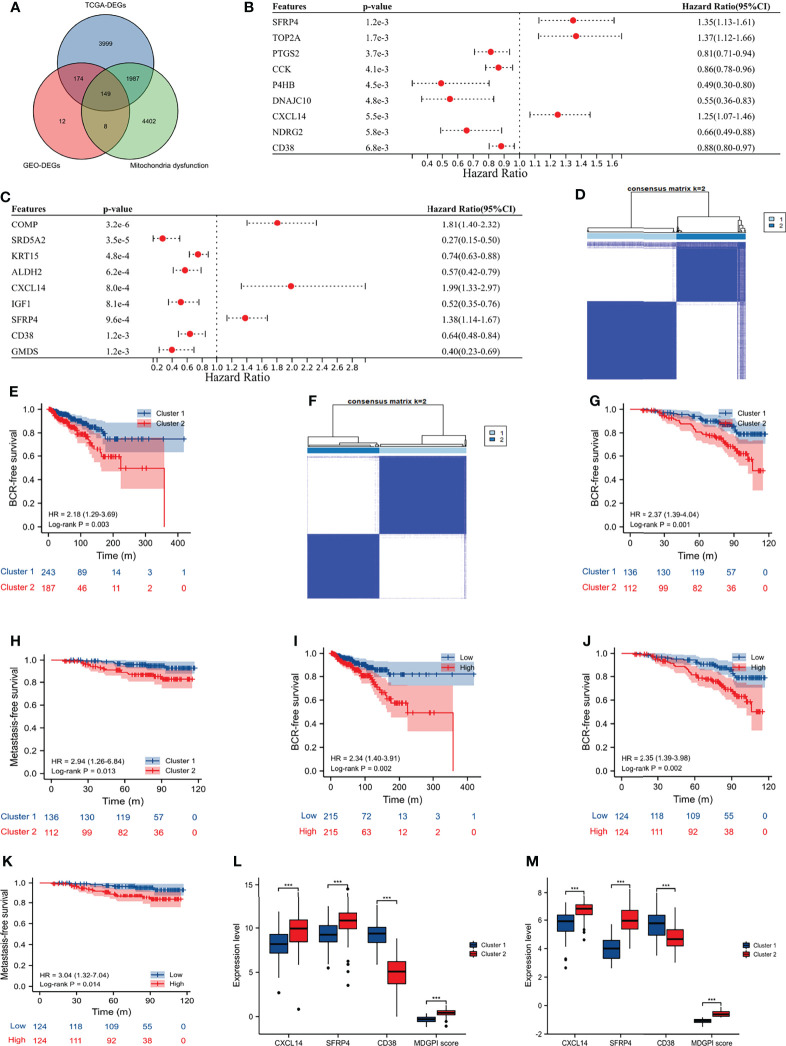
Figure 2.
Molecular subtype and MDGPI score. (A) Venn plot showing the interaction of differentially expressed genes between tumor and normal samples in the TCGA and GEO datasets, and mitochondrial dysfunction-related genes; (B) forest plot showing genes associated with BCR-free survival in the TCGA database; (C) forest plot showing genes associated with BCR-free survival in the GSE116918 (17); (D) cluster plot showing distinct two groups in the TCGA database; (E) Kaplan–Meier curve presenting the BCR-free survival difference of the two clusters in the TCGA database; (F) cluster plot showing distinct two groups in the GSE116918 (17); (G) Kaplan–Meier curve presenting the BCR-free survival difference of the two clusters in the GSE116918 (17); (H) Kaplan–Meier curve presenting the metastasis-free survival difference of the two clusters in the GSE116918 (17); (I) Kaplan–Meier curve presenting the BCR-free survival difference of the high- and low-risk groups based on the median of MDGPI in the TCGA database; (J) Kaplan–Meier curve presenting the BCR-free survival difference of the high- and low-risk groups based on the median of MDGPI in the GSE116918 (17); (K) Kaplan–Meier curve presenting the metastasis-free survival difference of the high- and low-risk groups based on the median of MDGPI in the GSE116918 (17); (L) comparisons between cluster 2 and cluster 1 in the TCGA database for CXCL14, SFRP4, CD38, and MDGPI score; (M) comparisons between cluster 2 and cluster 1 in the GSE116918 (17) for CXCL14, SFRP4, CD38, and MDGPI score. BCR, biochemical recurrence; MDGPI, mitochondrial dysfunction-related genetic prognostic index. ***, p <0.001.

