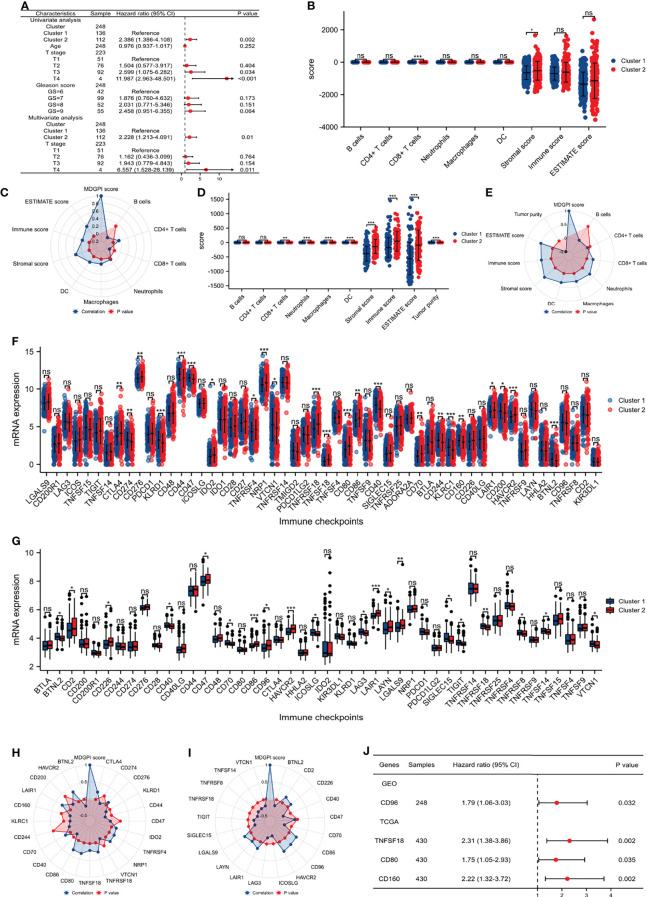
Figure 3.
Tumor immune microenvironment and checkpoints analysis. (A) COX regression analysis showing the results of clusters and other clinical parameters in the GSE116918 (17); (B) comparison between the two clusters for immune cells in the TCGA database; (C) radar plot showing the correlations between MDGPI score and immune cells in the TCGA database; (D) comparison between the two clusters for immune cells in the GSE116918 (17); (E) radar plot showing the correlations between MDGPI score and immune cells in the GSE116918 (17); (F) comparison between the two clusters for immune checkpoints in the TCGA database; (G) comparison between the two clusters for immune checkpoints in the GSE116918 (17); (H) radar plot showing the correlations between MDGPI score and immune checkpoints in the TCGA database; (I) radar plot showing the correlations between MDGPI score and immune checkpoints in the GSE116918 (17); (J) forest plot showing checkpoints associated with BCR-free survival in the TCGA database and GSE116918 (17). BCR, biochemical recurrence; MDGPI, mitochondrial dysfunction-related genetic prognostic index. ns, p ≥0.05; *, p <0.05; **, p <0.01; ***, p <0.001.

