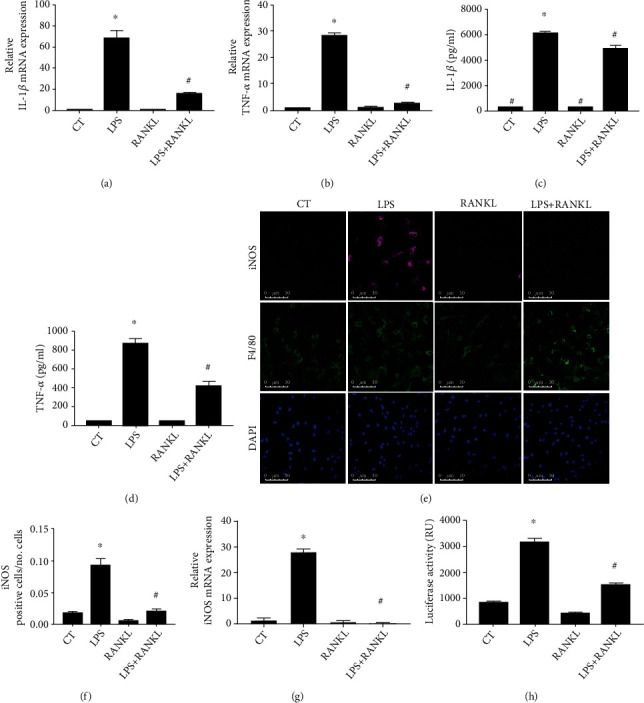
Figure 2.

RANKL lowers LPS response in macrophages. (a and b) IL-1β and TNF-α expression in THP1 macrophages stimulated with LPS (10 ng/ml) and RANKL (10 ng/ml) or costimulated with both (LPS+RANKL) for 24 h, detected by qPCR, and compared to the nonstimulated control group (CT). (c and d) IL-1β and TNF-α protein level in supernatant of THP1 macrophages stimulated with LPS (10 ng/ml) and RANKL (10 ng/ml) or costimulated with both (LPS+RANKL) for 24 h and detected by ELISA. (e) Representative images of macrophages immunostained to detect iNOS (magenta), F4/80 (green), and nuclei (DAPI, blue) by immunofluorescence in THP1 macrophages stimulated with LPS (10 ng/ml) and RANKL (10 ng/ml) or costimulated with both (LPS+RANKL) for 24 h. (f) Quantification of iNOS positive cells in LPS and RANKL stimulated THP1 macrophages. The quantification was based on the threshold in 6 fields of each sample by ImageJ software (n = 4). (g) Quantification of relative iNOS mRNA expression in THP1 macrophages stimulated with LPS and RANKL or costimulated with both (LPS+RANKL) for 24 h, detected by qPCR, and compared to the nonstimulated control group (CT). (h) Quantification of NF-κB activation in THP1 macrophages transfected with a plasmid expressing NF-κB-driven luciferase stimulated with LPS (10 ng/ml) and RANKL (10 ng/ml) or costimulated with both (LPS+RANKL) for 24 h and detected by luciferase activity presented as relative units (RU). A one-way ANOVA followed by Bonferroni's multiple comparisons test was performed to compare all groups (∗p < 0.01 vs. CT and #p < 0.01 vs. LPS). The data represent the mean of three independent experiments and are presented as means ± SD.
