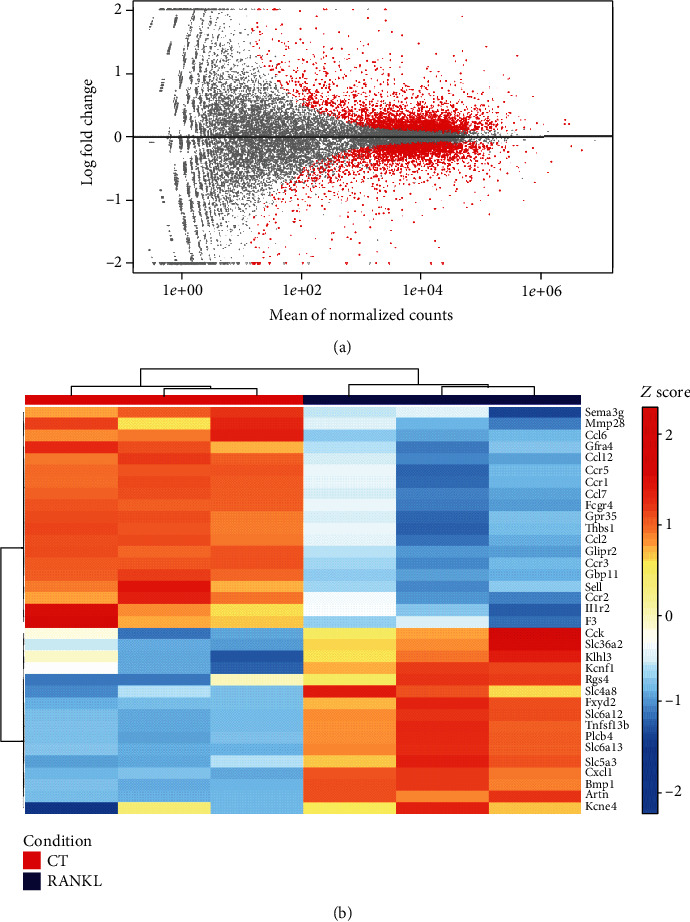
Figure 5.

RANKL downregulates the pathways related to chemotaxis in BMDM. (a) MA plot for log2 folds changes values against normalized counts for each gene in the analysis. Red points mark genes with FDR < 0.1. (b) Visualization as a heat map of genes that are up- and downregulated in BMDM without (CT) or with RANKL stimulation (10 ng/ml) (RANKL) for 24 h.
