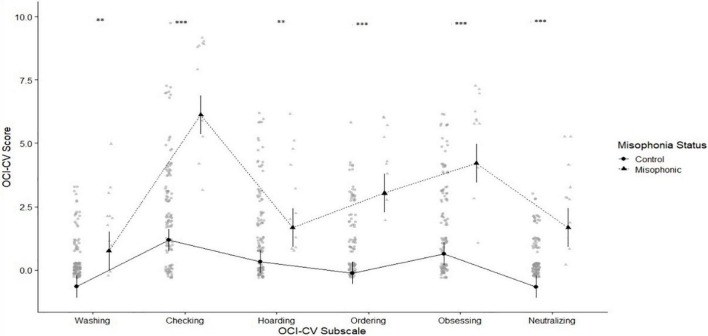
FIGURE 2.
Means plot showing greater scores for misophonics (shown in triangle) and controls (shown in circles) in each of the OCI subscales (from left to right: Washing, Checking and Doubting, Hoarding, Ordering, Obsessing, and Neutralizing). Here and in all similar figures, means are shown with black circles/triangles, while grey points represent the raw data, with overlapping points appearing darker. Here and throughout, error bars show 95% confidence intervals, and the asterisks represent significant p values as follows: * < 0.05, ** < 0.01, and *** < 0.001.

