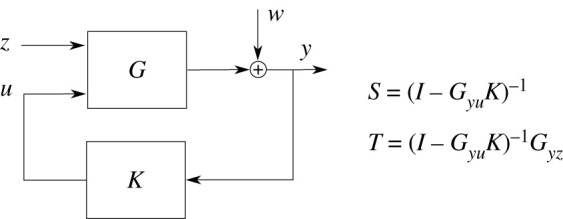
Figure 6.

Block diagram of the process G to be controlled and the controller K feedback loop used in this paper. The signal z signifies the external inputs, y the measured output, w are the process disturbances (e.g. modelling errors or external perturbations) and u is the control signal computed by the controller K. The significance of the functions S and T is discussed in the text.
