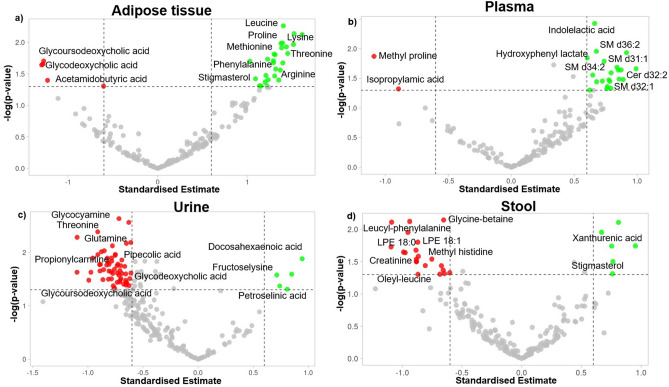
Figure 2.
Volcano plot of significantly different metabolites from the exercise intervention in (a) adipose tissue, (b) plasma, (c) urine, (d) stool. The data of all metabolites are plotted as the standardized estimates of the linear mixed model for the interaction between group (controls and intervention) and time (baseline and endpoint of the exercise intervention) versus the negative logarithm of the raw p-values. Thresholds are shown as dashed lines. Metabolites selected as significantly increased in the intervention group are highlighted as green dots, and those decreased significantly in the intervention group compared to the controls are shown as green dots.

