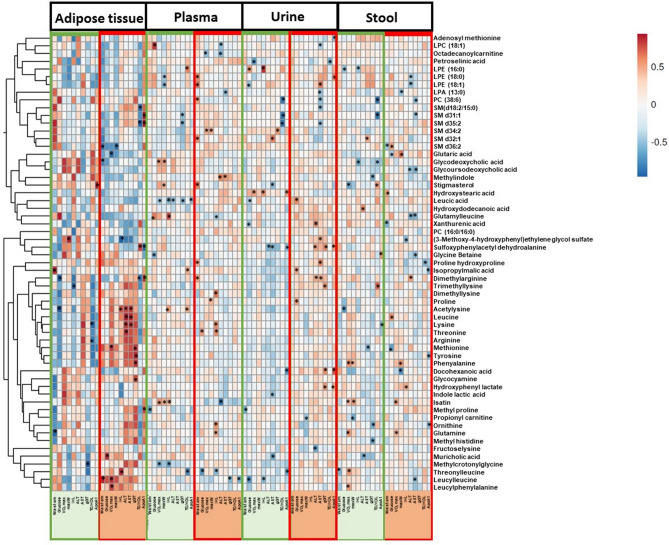
Figure 3.
Heatmap representing the significant Spearman's correlations (adjusted for age, gender, BMI, and T2D) between the clinical parameters (column-wise) and the top significantly different metabolites identified in all sample matrices combined (row-wise) using delta change from baseline to post intervention. The color of the cells indicates the strength of the relationship (rs). The cells marked with asterisks (*) demonstrate significant correlations (p < 0.05). Green sidebars indicate the control group, and red sidebars represent the exercise intervention group. Waist cm waist circumference, IHL intrahepatic lipid content, ALT alanine aminotransferase, AST aspartate transaminase, gGT gamma-glutamyl transferase, VO2max the maximum rate of oxygen consumption (cardiorespiratory fitness), maxW maximum workload achieved, TC total cholesterol, HDL high-density lipoprotein cholesterol.

