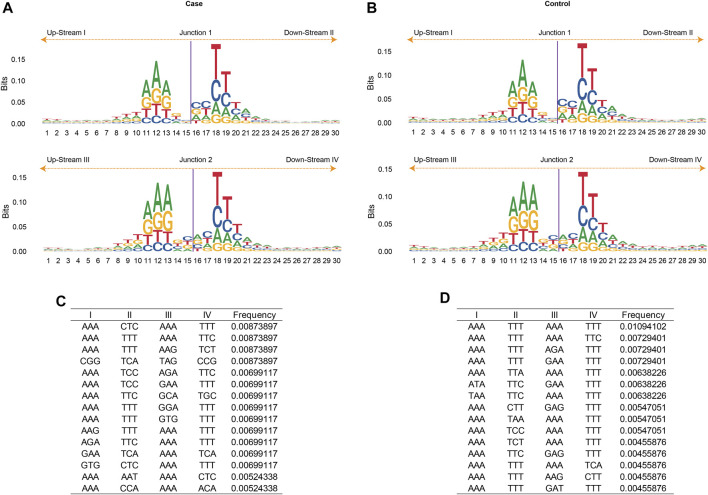
FIGURE 4.
The motif analysis of eccDNA junctions. The nucleotide composition from 15 bp upstream to 15 bp downstream of the start (Junction 1) and end position (Junction 2) of the eccDNA junction in acute gout (A) and healthy control (B). The frequency of base distribution at each position is plotted as a stacked histogram. The size of four bases at each position in the figure reflects their frequency. The 3-bp motifs flanking the start and end site in acute gout (C) and healthy control (D). Data were ranked by motif frequencies. I, II, III, IV refers to 3-bp upstream of start site, 3-bp downstream of start site, 3-bp upstream of end site, and 3-bp downstream of end site, respectively.

