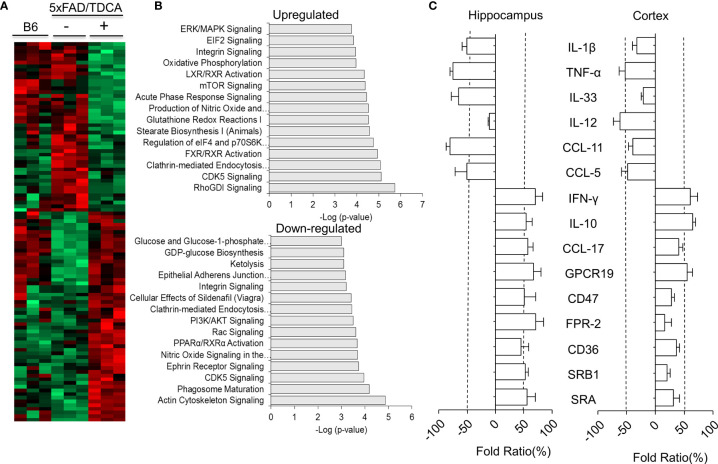
Figure 5.
Proteomic analyses of mouse brains. B6 or 5xFAD (n = 3/group) mice were treated with TDCA (1 mg/kg i.p.) for 10 weeks. (A), Heatmap showing the differential expression of proteomes in the brain. Each row represents a protein, and each column represents an individual mouse. (B), The top 15 canonical pathways “upregulated” or “downregulated” by treatment with TDCA are shown. (C), Cytokines, chemokines, immune checkpoint molecules, and scavenger receptors expressed in the hippocampus and cortex were determined by qPCR based on proteomic profiling. Fold ratios denote the ratio between CtTDCA and Ctvehicle. Fold ratios less than zero indicate that the expression was inhibited upon TDCA treatment.

