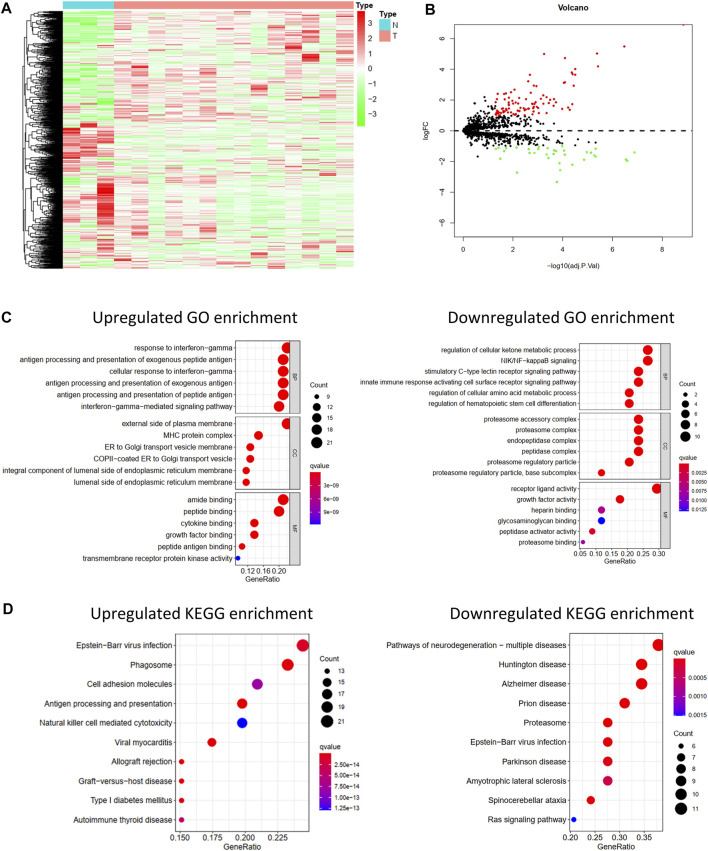
FIGURE 1.
Differentially expressed IRGs and its function enrichment analysis. Heatmap(A) and volcano plot (B) of 1,793 immune-related genes in normal bone tissues and osteosarcoma tissues from GSE16088. (C) GO pathway enrichment of upregulated and downregulated IRGs. (D) KEGG pathway enrichment of upregulated and downregulated IRGs.

