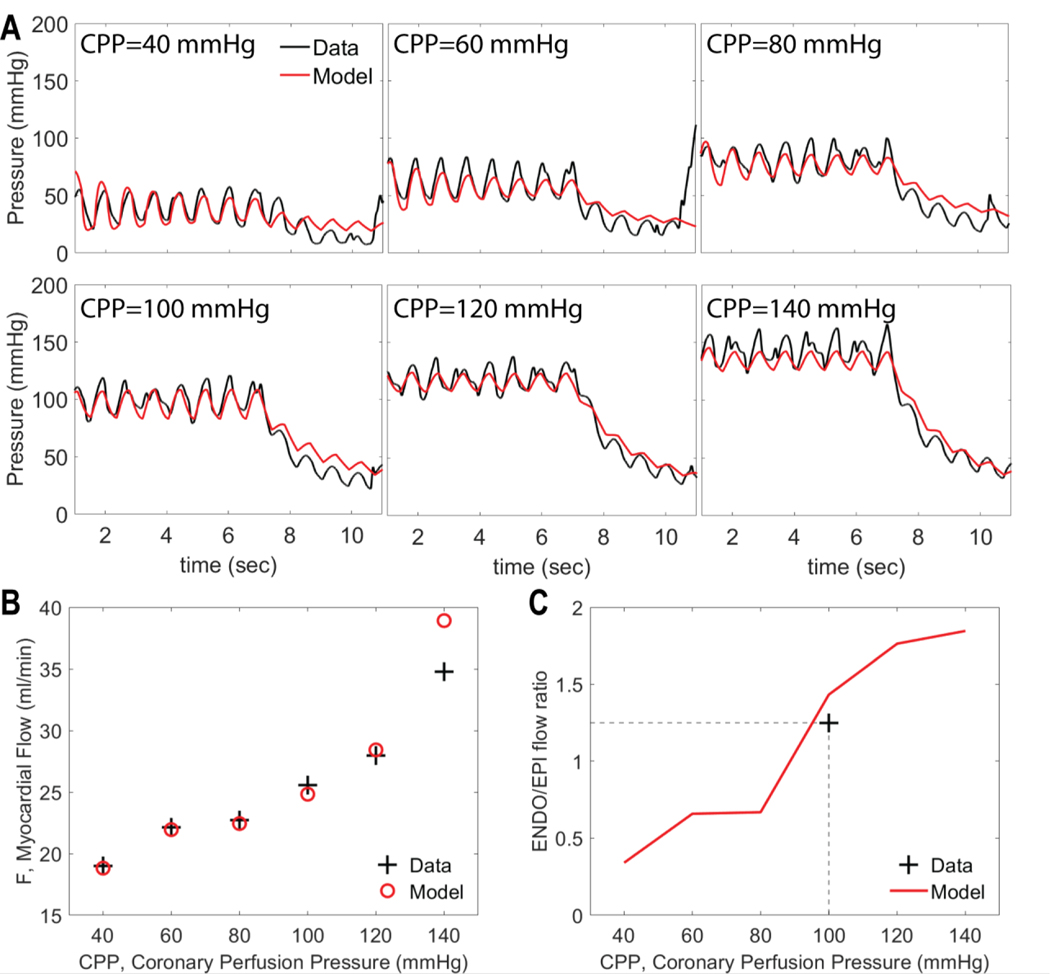
Figure 1.
An example data set used to identify Model 1 for an individual animal under control conditions. A. Pressure recordings obtained at 6 levels of CPP following occlusion of left anterior descending (LAD) artery. The artery is occluded at ∼7 sec and the decay distal to the occlusion is recorded. B. Total LAD flow, measured at different values of CPP. C. Myocardial subendocardial-to-subepicardial (ENDO/EPI) flow ratio before the occlusion. Data in Panels A and B are from Kiel et al. (Kiel et al., 2018). Measured ENDO/EPI flow ratio under baseline control conditions is targeted to 1.25 (see text for details). Measured data in panels is plotted in black; model simulations in red.

