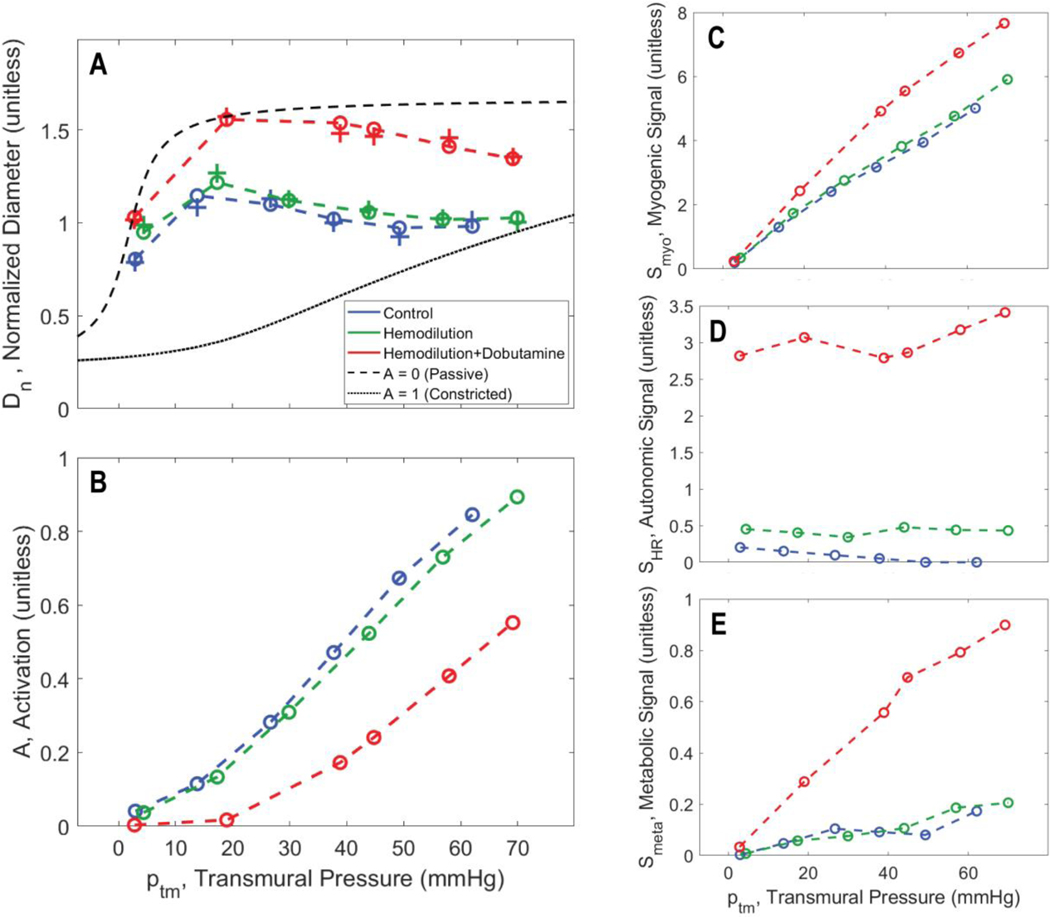
Figure 3.
Vasoregulation as a function of transmural wall pressure. A. Model predictions of relative resistance vessel diameters are shown for the midwall layer for pig C for the midwall layer. Diameters for the three experimental conditions, associated with the fits of Model 1 to the zero-flow pressure experiment, are plotted as “+” markers: blue for control; green for hemodilution; and red for hemodilution + dobutamine. The matches of Model 2-based predictions (using the ‘F M’, flow times MVO2, metabolic signal) to the diameter estimates are plotted as “o” markers connected by dashed lines. B. Predicted total smooth muscle activation is plotted as a function of transmural pressure in the zero-flow pressure experiment. C. Predicted myogenic activation signal is plotted as a function of transmural pressure in the zero-flow pressure experiment. D. Predicted autonomic activation signal is plotted as a function of transmural pressure in the zero-flow pressure experiment. E. Predicted metabolic activation signal is plotted as a function of transmural pressure in the zero-flow pressure experiment.

