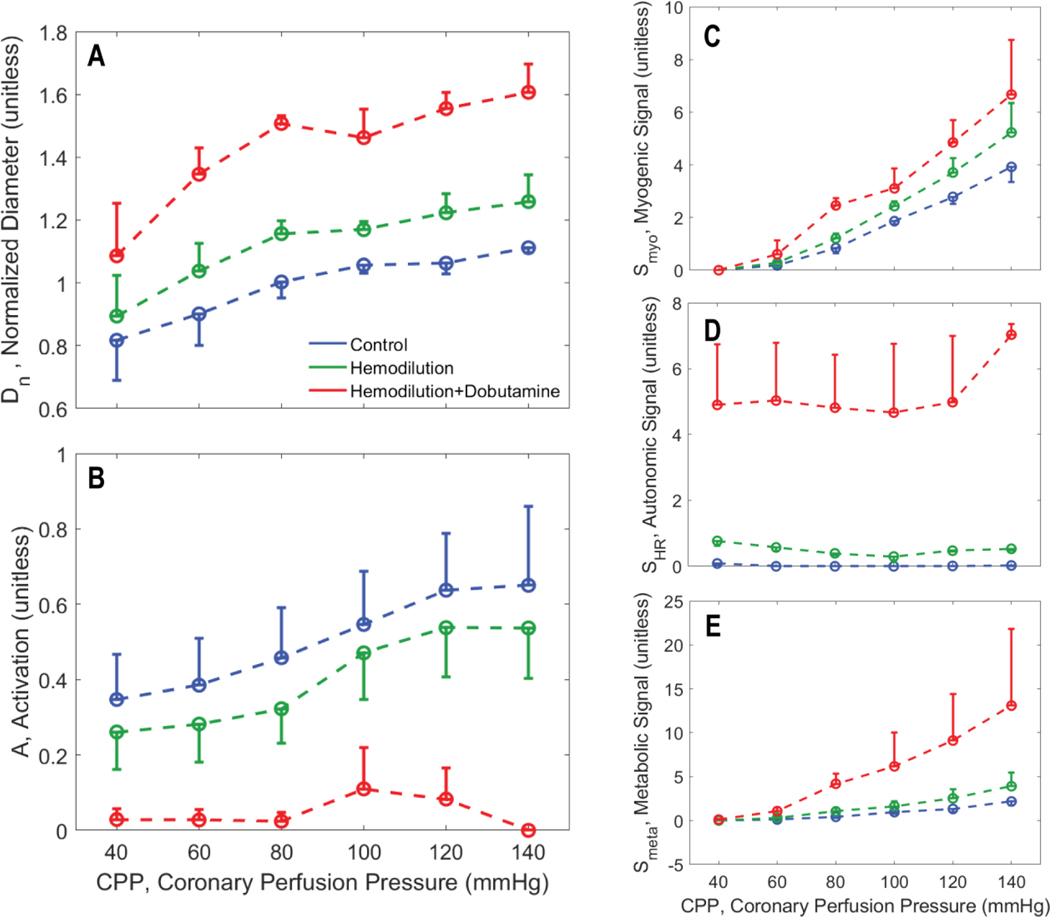
Figure 7.
Vasoregulation in subendocardial vessels. A. Predicted mean and standard error of subepicardial resistance vessel diameter is plotted as a function of CPP. B. Predicted mean and standard error of total vessel activation is plotted as a function of CPP. C. Predicted mean and standard error of myogenic activation signal is plotted as a function of CPP. D. Predicted mean and standard error of autonomic activation signal is plotted as a function of CPP. E. Predicted metabolic activation signal is plotted as a function of CPP.

