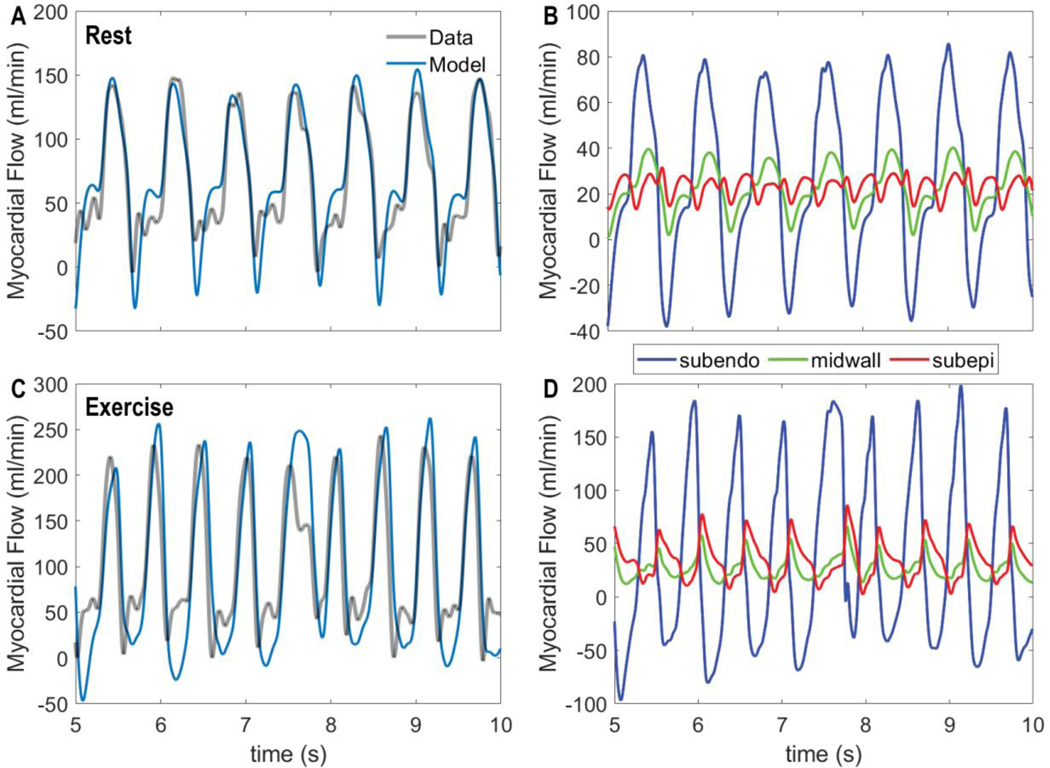
Figure 9.
Coronary flow dynamics in rest versus exercise. A. Model-predicted total LAD flow under resting control conditions is compared to measured flow. B. Predicted contributions of subendocardial, midwall, and subepicardial flow to total LAD flow under resting conditions are shown. C. Model-predicted total LAD flow under exercise conditions is compared to measured flow. D. Predicted contributions of subendocardial, midwall, and subepicardial flow to total LAD flow under exercise conditions are shown. In both rest and exercise conditions the model simulations reflect the integrated model using the top-ranked using the ‘F M’, flow times MVO2, metabolic signal.

