FIGURE 1.
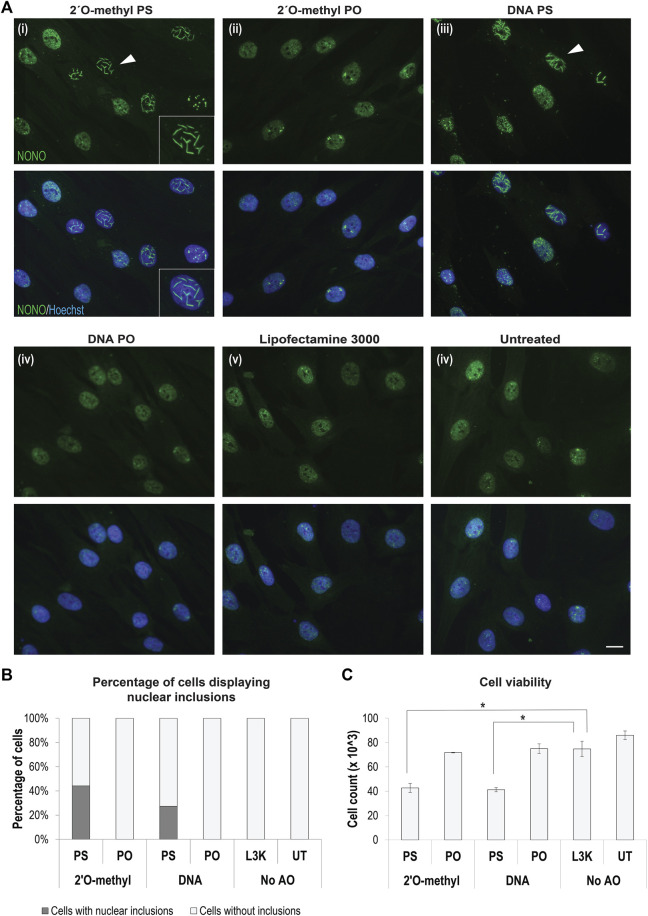
Formation of AO-induced nuclear inclusions associated with cytotoxicity. (A) fibroblasts stained for NONO following transfection with different chemically modified antisense oligonucleotides, including representative images of, (i) 2′ O-methyl modified bases on a phosphorothioate (PS) backbone, (ii) 2′ O-methyl modified bases on a phosphodiester (PO) backbone, (iii) DNA unmodified bases on a PS backbone, (iv) DNA unmodified bases on an unmodified PO backbone, and compared to (v) fibroblasts treated with Lipofectamine 3000 (L3K) or (vi) left untreated. The white arrow indicates nuclear inclusions, magnified within inset (i). Scale bars = 10 μm; (B) graph showing the percentage of fibroblasts containing nuclear inclusions following antisense transfection as in (A) at 100 nM, with a minimum of 200 cells counted per sample; (C) graph showing the number of viable fibroblasts following antisense transfection as in (A) (n = 4), error bars represent standard error of the mean and p-values were calculated using an unpaired t-test, where * denotes p < 0.05.

