FIGURE 2.
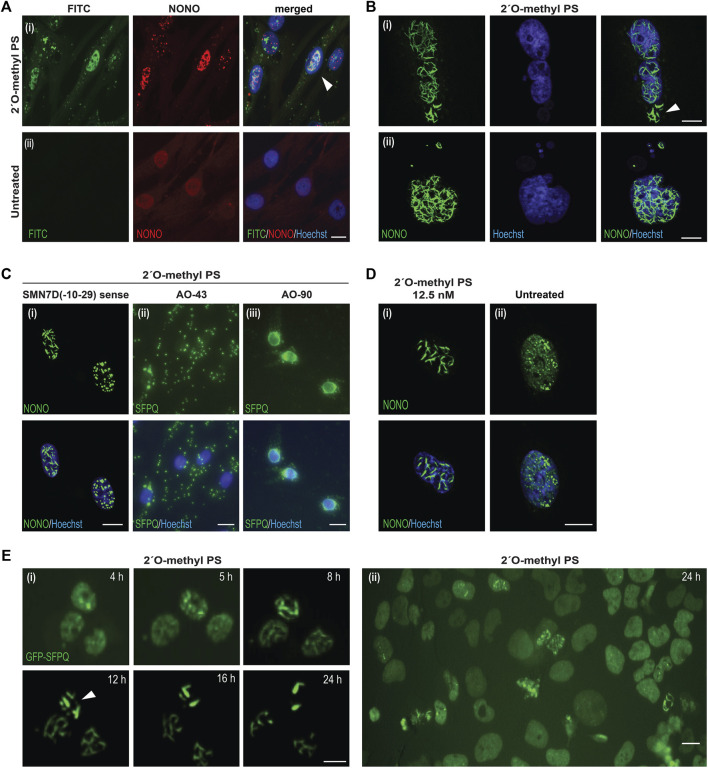
Characterisation of AO-induced nuclear inclusions. (A) fibroblasts transfected with a FITC-labelled 2′ O-methyl phosphorothioate (PS) AO (100 nM) and co-stained for NONO (i), compared to untreated cells (ii). Colocalization of NONO with the PS-AO is indicated by the white arrow; (B) fibroblasts stained for NONO show, (i) nuclear inclusions without evidence of nuclear staining after 2′ O-methyl phosphorothioate SMN7D(-10-29) transfection, as indicated with the white arrow, (ii) nuclear blebbing after 2′ O-methyl phosphorothioate control AO transfection; (C) cells transfected with different phosphorothioate AO sequences cause varied patterns of DBHS protein mislocalisation, including: nuclear inclusions of NONO protein in the form of filaments or foci induced by transfection the SMN7D(-10-29) sense sequence AO (iii), cytoplasmic aggregation and accumulation of SFPQ protein with AO 43 (Supplementary Table S3), or accumulation of SFPQ around the nuclear envelope following transfection with AO 90 (Supplementary Table S3); (D) nuclear inclusions observed in fibroblasts transfected with 12.5 nM of 2′ O-methyl phosphorothioate SMN7D(-10-29) antisense stained for NONO (i), compared to untreated fibroblasts (ii); (E) live cell imaging time-course of U2OS cells expressing endogenous GFP-SFPQ showing the formation of nuclear inclusions over 24 h (i) following 2′ O-methyl phosphorothioate control AO transfection (100 nM), inclusions are indicated by the white arrow, with a wider field of view at 24 h displayed in (ii). All scale bars = 10 µm.

