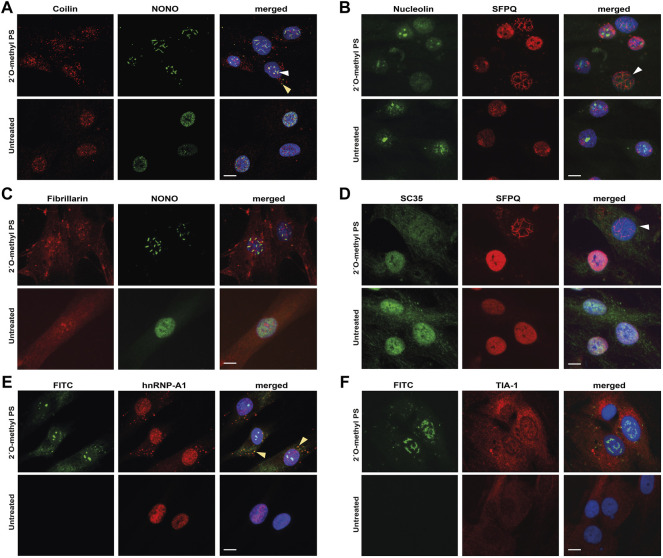
FIGURE 3.
Staining of nuclear and cytoplasmic bodies following 2′ O-methyl phosphorothioate (PS) transfection in fibroblasts. Representative images following 2′ O-methyl PS AO transfection (100 nM, 24 h) with either the SMN7D(-10-29) or the control antisense sequences (A–D) or the FITC-labelled SMN7D(-10-34) sequence (E–F), showing: (A) staining for Cajal body marker coilin (red) and NONO (green) overlayed with Hoechst, with NONO and coilin colocalization indicated with the arrows within the nucleus (white) and cytoplasm (yellow); (B) staining for nucleolar marker nucleolin (green) and SFPQ (red) overlayed with Hoechst (blue), with a cell containing nuclear inclusions and no nucleolar nucleolin staining indicated by the white arrow; (C) staining for nucleolar marker fibrillarin (red) and NONO (green) overlayed with Hoechst; (D) staining for nuclear speckle marker SC35 (green) and SFPQ (red) overlayed with Hoechst, with a cell containing nuclear inclusions and no nuclear SC35 staining indicated by the white arrow; (E) images of FITC fluorescence, overlayed with paraspeckle and stress granule marker hnRNP-A1 (red) and Hoechst, with FITC and hnRNP-A1 colocalization indicated by the yellow arrow; and (F) images of FITC fluorescence, overlayed with stress granule marker TIA-1 (red) and Hoechst. All scale bars = 10 µm.

