FIGURE 4.
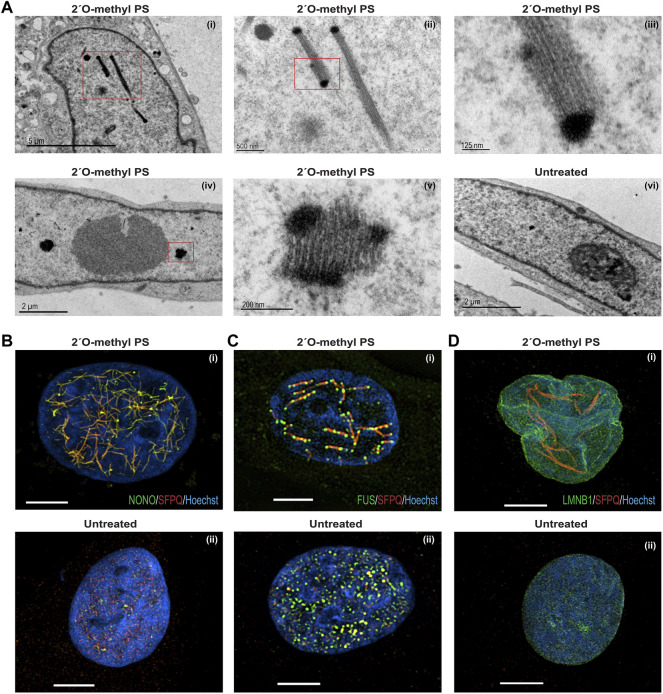
Structural analysis of nuclear inclusions in 2′ O-methyl phosphorothioate transfected fibroblasts. Fibroblasts were transfected with the 2′ O-methyl phosphorothioate AO, SMN7D(-10-29) at 100 nM, for 24 h. Transfected and untreated control cells were processed for transmission electron microscopy (A) and super resolution fluorescence microscopy (B–D). Showing (A) transmission electron microscopy of (i) nucleus with filament-like nuclear inclusions (scale = 5 µm), (ii) higher magnification of (i) (scale = 500 nm), (iii) higher magnification of (ii) showing filament structure (scale = 125 nm), (iv) nucleus with foci-like nuclear inclusions (scale = 2 µm), (v) higher magnification of (iv) (scale = 200 nm), and (vi) untreated nucleus (scale = 2 µm); (B) super resolution fluorescence microscopy of SFPQ (red) and NONO (green) co-staining following 2′ O-methyl phosphorothioate (SMN7D(-10-29)) transfection (i) and an untreated cell (ii); (C) super resolution fluorescence microscopy of SFPQ (red) and FUS (green) co-staining following transfection (i) and an untreated cell (ii); (D) super resolution fluorescence microscopy of SFPQ (red) and LAMIN-B1 (green) co-staining following transfection (i) and an untreated cell (ii). For all SIM images scale bar = 5 µm.

