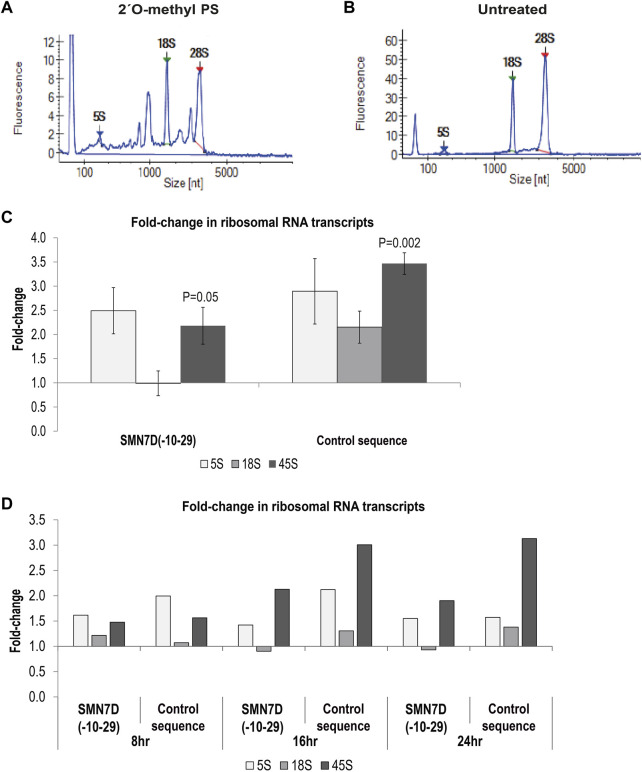
FIGURE 5.
– Analysis of ribosomal RNA processing. Showing bioanalyser trace of rRNA from (A) 2′ O-methyl phosphorothioate control sequence AO transfected cells, and (B) untreated cells; (C) qPCR analysis of 5, 18 and 45S rRNA levels following 2′ O-methyl phosphorothioate transfection with the SMN7D(-10-29) or control AO sequences (24 h). rRNA levels were normalised against TBP and compared to those in untreated cells where untreated = 1 (n = 3). Error bars represent the standard error of the mean, and p-values were calculated comparing each AO treatment group to the untreated group using an unpaired t-test; and (D) qPCR analysis of rRNA levels over 8, 16 and 24 h; analysis as in (C) (n = 1).

