FIGURE 6.
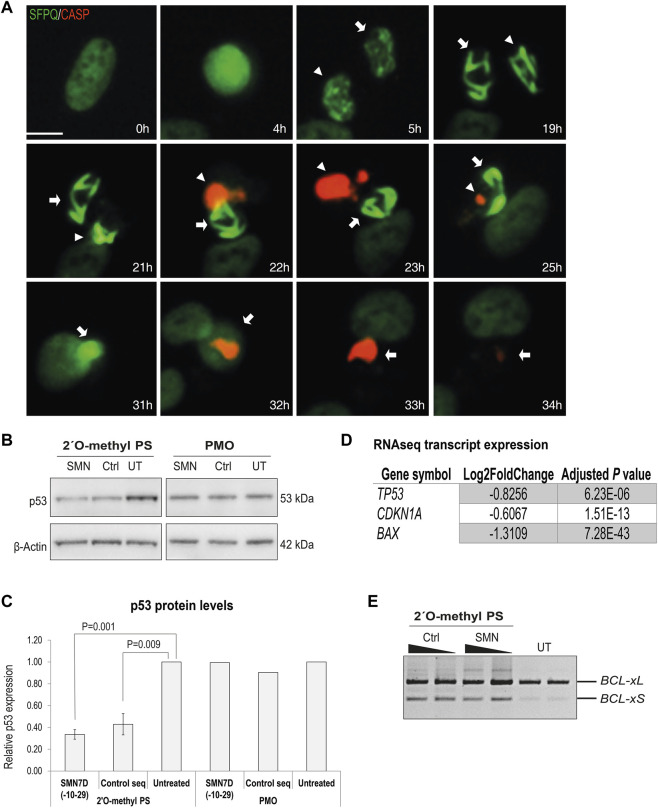
Analysis of cellular toxicity following 2′ O-methyl phosphorothioate AO transfection. (A) live cell imaging over time of U2OS cells with endogenous GFP-SFPQ (green) transfected with the 2′ O-methyl phosphorothioate control sequence and stained for caspase 3/7 activation (red). Two sister cells are annotated with arrows, and scale bar = 10 μm; (B) western blot of p53 and β-actin levels in fibroblasts following 2′ O-methyl phosphorothioate AO (n = 3) and PMO transfection (n = 1); (C) densitometry analysis of (B) where p53 levels are normalized to β-actin and compared to those in untreated cells where untreated = 1. Error bars represent the standard error of the mean and p-values were calculated using an unpaired t-test; (D) table showing log2Fold-change in expression of key transcripts involved in p53 signaling pathway from RNAseq analysis following 2′ O-methyl phosphorothioate AO transfection; and (E) RT-PCR analysis of BCL2 transcripts in fibroblasts following 2′O-methyl phosphorothioate AO transfection, as indicated at 100 and 50 nM (24 h).

