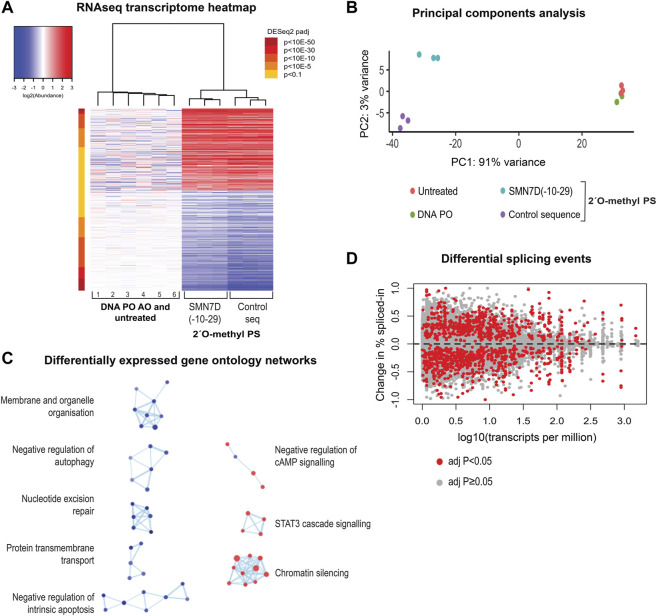
FIGURE 7.
RNA sequencing analysis of 2′ O-methyl phosphorothioate AO transfected fibroblasts. (A) heatmap of all differentially expressed transcripts in control (1, 4, 5-untreated and 2, 3, 6, DNA PO AO) and 2′ O-methyl phosphorothioate AO SMN7D(-10-29) and control AO sequence transfected (100 nM, 24 h) cells, whereby red represents overexpressed transcripts, and blue represents under-expressed transcripts; (B) principal components analysis of RNA profile between groups; (C) gene ontology (GO) network of significantly affected cellular pathways in samples from transfected, compared to untreated and DNA AO transfected cells. GO terms are represented as dots being either overexpressed (red) or under-expressed (blue), and groups with greater than 50% of genes in common are linked; and (D) differential changes in splicing displaying the change in percent spliced in events against total transcript expression as transcripts per million.

