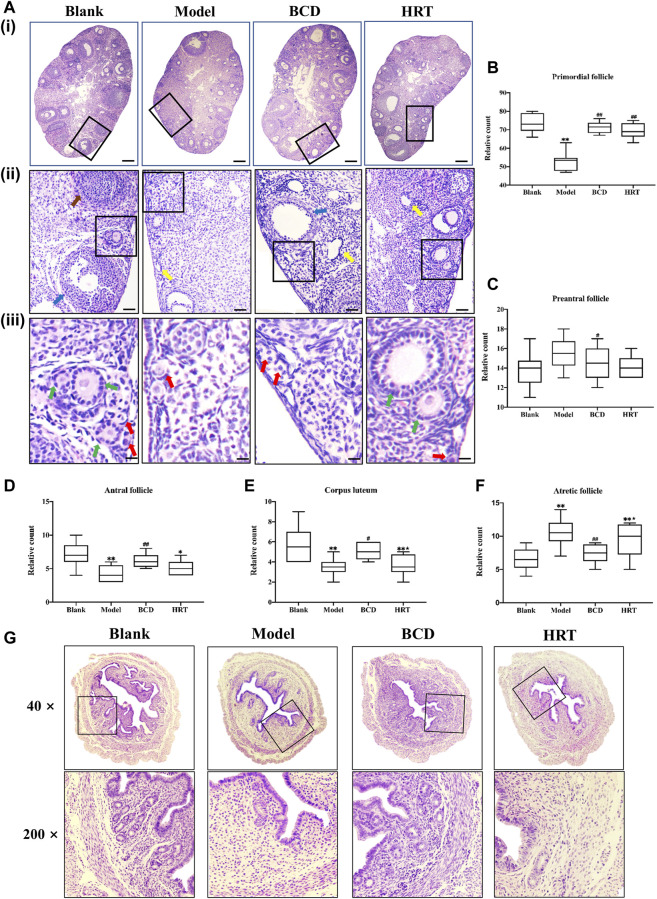
FIGURE 4.
BCD protects the ovarian reserve and uterus of TWP-induced POI mice. (A) HE-stained ovarian sections and their representative images are depicted (×40, ×100×, and ×400 magnification). The red arrow shows primordial follicles, the green arrow shows preantral follicles, the blue arrow shows antral follicles, the yellow arrow shows atretic follicles, and the brown arrow shows a corpus luteum. The scale bars represent 200 μm (i), 50 μm (ii) and 25 μm (iii). Image analyses included three serial sections per mouse, which were then evaluated for the total primordial (B), preantral (C), antral (D), corpus luteum (E), and atretic (F). (G) HE-stained uterine sections and their representative images are depicted (×40, ×200 magnification). Data is visualized in terms of means ± SEM. (n = 8, *p < 0.05, **p < 0.01, compared with the Blank group; # p < 0.05, ## p < 0.01, compared with the Model group; ★p < 0.05, ★★p < 0.01, compared with the BCD group).

