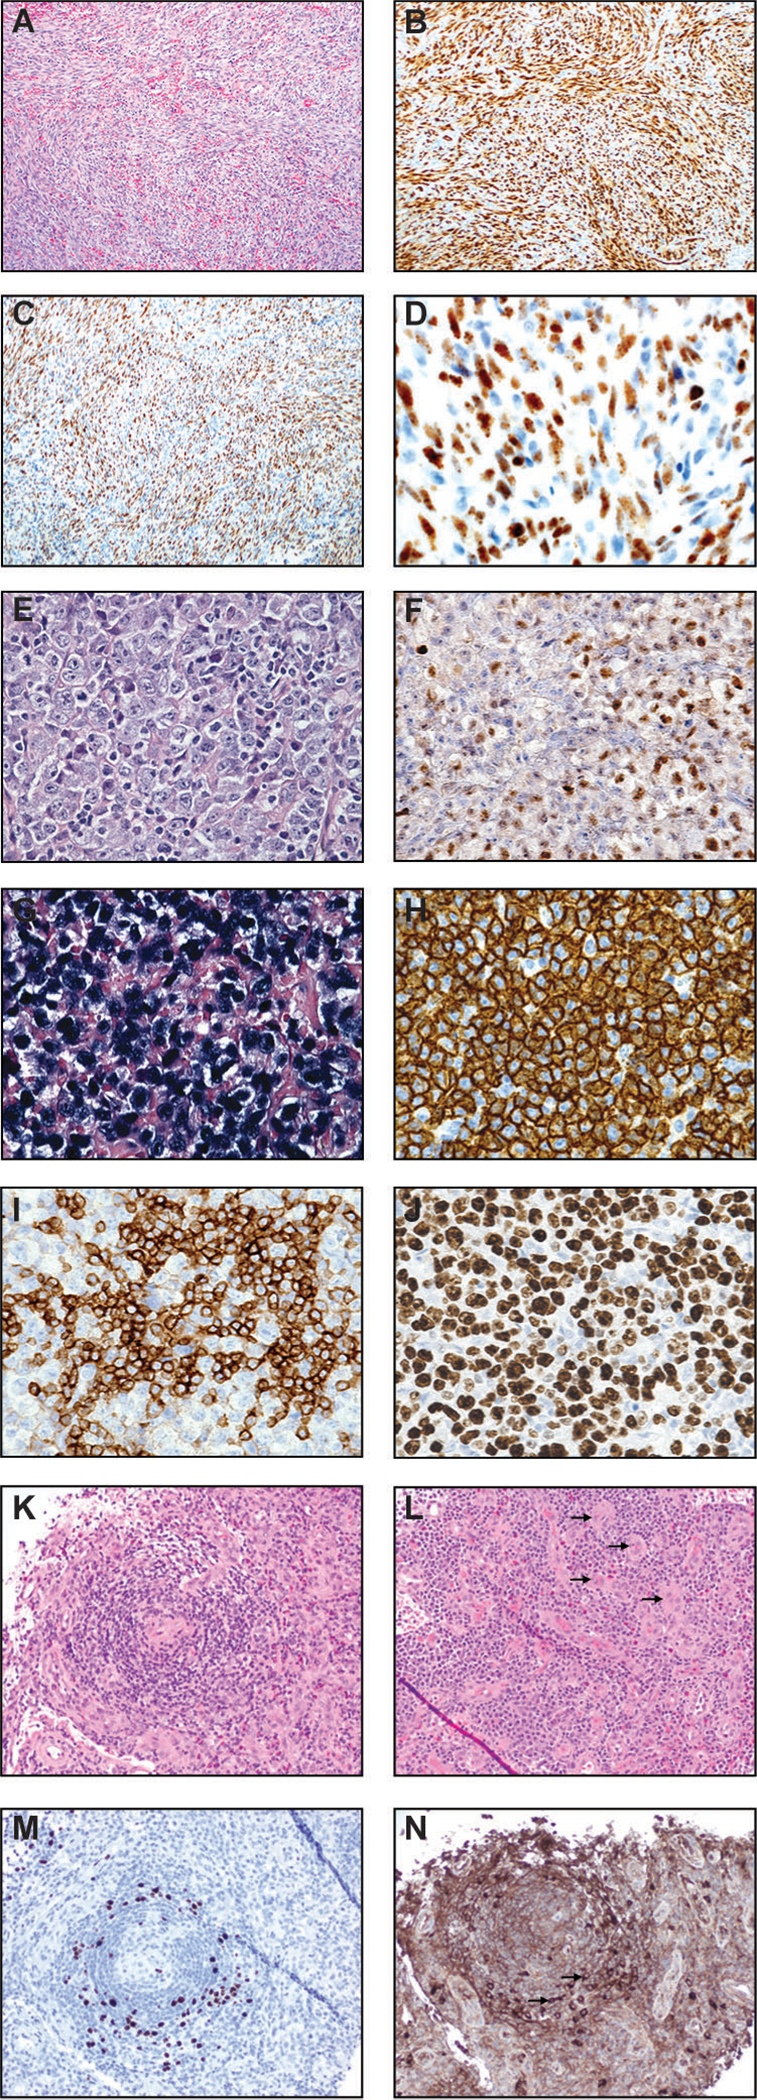
Figure 7.

Kaposi sarcoma (A-D), primary effusion lymphoma (PEL) (E-J), and multicentric Castleman disease (K-N). (A) H&E image (100x) of a lymph node involved by Kaposi sarcoma shows intersecting fascicles of spindled cells. There are intervening slit-like/sieve-like spaces with entrapped red blood cells. (B) ERG immunostain (100x) is positive in essentially all spindled cells. Other vascular markers such as CD31 and CD34 are also positive in KS (not shown). (C) KSHV LANA immunostain (100x) is positive in virtually all nuclei of Kaposi sarcoma cells. (D) KSHV LANA immunostain at a high power (400x) demonstrates the classic punctate/speckled staining of KS nuclei. Primary effusion lymphoma (PEL) (E-J). (E) H&E image at high power field (600x) displays large and pleomorphic PEL cells with anaplastic nuclei, variably prominent nucleoli, and abundant cytoplasm. There is plasmablastic morphology. Mitotic figures and mummified cells are easily identified. (F) KSHV LANA stain (600x) shows positive staining in PEL nuclei, a key to the diagnosis. (G) In situ hybridization stain for EBV-encoded small RNA (600x) highlights neoplastic cells in this PEL case. (H) CD30 immunostain (600x) shows diffuse and strong membranous and cytoplasmic staining of PEL cells. (I) MUM1/IRF-4 stain (600x) demonstrates plasmacytic differentiation. (J) Ki-67 immunostain (600x) demonstrates a high proliferation index. Multicentric Castleman disease (K-N). (K) H&E image (200x) shows a regressed germinal center concentrically involved (“onion skinning” pattern) by numerous lymphoid cells and plasma cells/plasmablasts. (L) H&E image (200x) demonstrates numerous plasma cells in clusters and increased vessels (arrows). (M) KSHV LANA stain (200x) highlights plasmablasts. (N) Lambda immunostain (200x) highlights monotypic plasmablasts.
