
Figure 6.
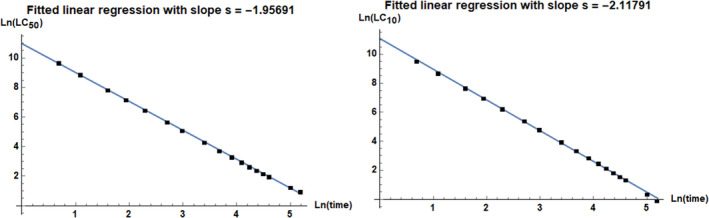
Linear regression of the natural logarithm (Ln) of LC50 (left) and LC10 (right) values vs. the natural logarithm of the associated exposure time (using equation 2), based on data from Jachimowicz and El Sherbiny (1975). According to the LC50 (left), the slope value of the linear regression, which quantifies Haber's exponent, is −1.95691 with 95% confidence interval [−1.97486, −1.93896]. Also, the intercept parameter (log k) is 10.9746 with 95% confidence interval [10.9104, 11.0389]. According to the LC10 (right), s = −2.11791 with 95% confidence interval [−2.14663, −2.08919], and log k = 11.0802 with 95% confidence interval [10.9775, 11.183]
- LC10: lethal concentration 10%, LC50: lethal concentration 10%; Ln: natural logarithm.