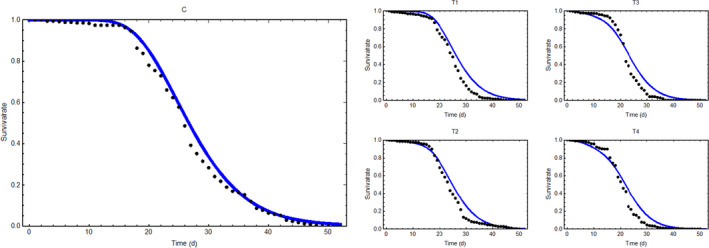
Fit of the modified GUTS model to the data from Gregorc et al. (
2020); (left) survival in the control (C), and (right) four exposure levels (T1 = 100 mg, T2 = 500 mg, T3 = 1,000 mg and T4 = 1,500 mg). In the control, the parameters of the cumulative distribution function of the log‐normal distribution (see equation B1) were fitted to p1 = 3.2838 and p2 = 0.2772. For the whole data set, a log‐likelihood value of 5,881.54 was obtained for the best fit, and parameter values have been determined to k
D = 3.15·10
−4; b = 3.81·10
−3; z = 2.71·10
−6

