
Figure B.2.
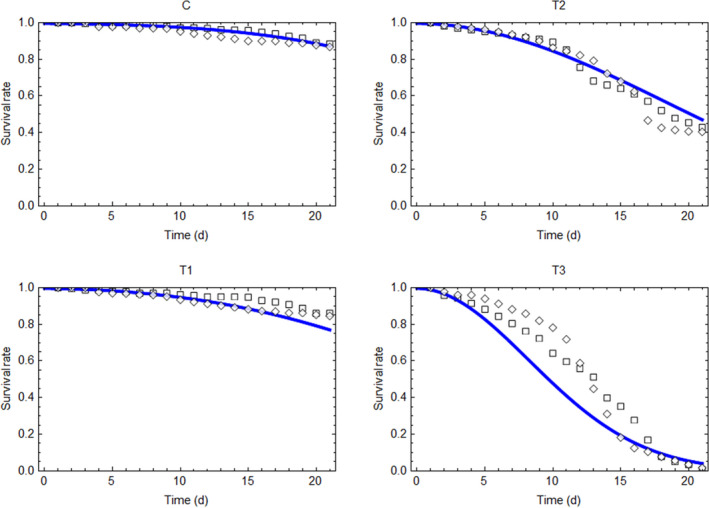
Fit of the modified GUTS model to the data from Jachimowicz and El Sherbiny (1975); survival in the control (C), and 3 exposure levels (T1 = 30 mg, T2 = 150 mg, T3 = 750 mg). Square symbols depict the ‘1973’ data series, diamonds the ‘1974’ data series. In the control, the parameters of the cumulative distribution function of the log‐normal distribution (see equation B1) were fitted to p1 = 36.1367, p2 = 16.2998. For the whole data set, a log‐likelihood value of 3500.002 was obtained for the best fit, and parameter values have been determined to kD = 5.38·10−3, b = 23.60·10−3, z = 4.17·10−94
- d: day.