
Figure B.3.
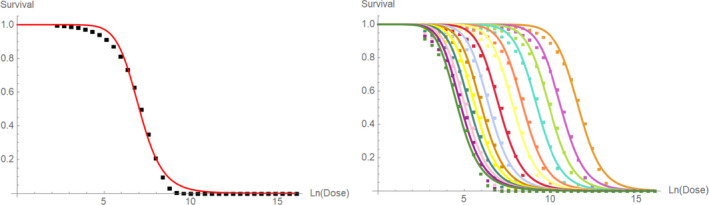
Survival data for different exposure durations and doses as extrapolated by the calibrated GUTS model (symbols), and corresponding fits of the log‐logistic dose‐response model (lines) based on data from Gregorc et al. (2020). (left) Example for an exposure duration of 30 days. (right) All dose response curves and simulated data points