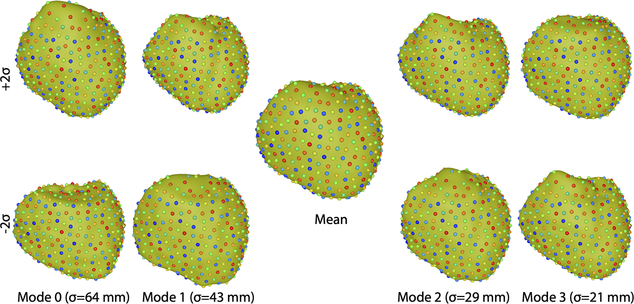
Fig. 1.
Pericardial shape model based on nine segmentations of the same patient. The central image shows the mean shape while the other images show the shapes of the four dominant modes of variation (columns) computed at plus (top row) and minus (bottom row) two standard deviations along that mode. Point colors correspond across segmentations.

