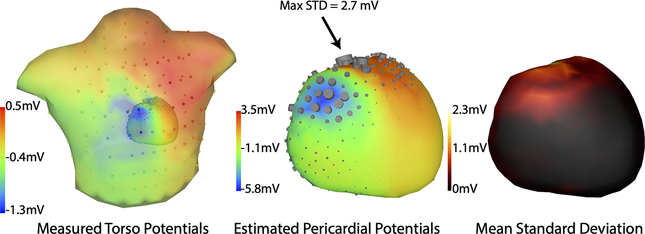
Fig. 2.
Spatial distribution of uncertainty from segmentation variability. Left, center: Torso and pericardial potentials are shown near the peak of the QRS wave. Color shows potentials while the sizes of the cylinders on the surfaces represent relative standard deviation at each location, Right: Mean standard deviation over the cardiac cycle.

