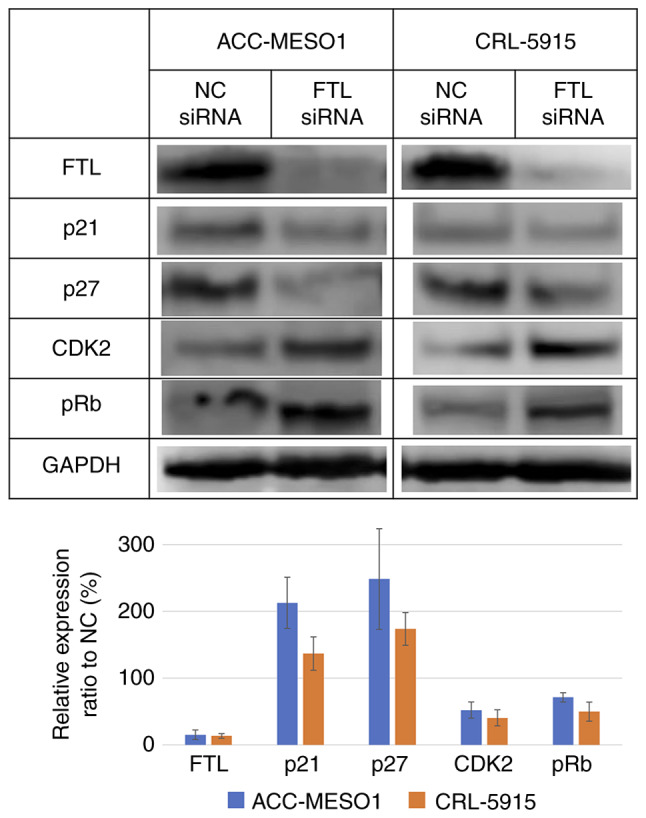
Figure 4.

Western blotting of extracts from FTL siRNA transfected cell lines indicates suppression of the expression levels of FTL compared with cells transfected with NC siRNA, increased expression levels of p21 and p27 and decreased levels of CDK2 and pRb. The graph shows the relative expression levels of each protein in the FTL siRNA-transfected cell line compared with NC. FTL, ferritin light chain; pRB, phosphorylated retinoblastoma protein; NC, negative control; siRNA, short interfering RNA.
