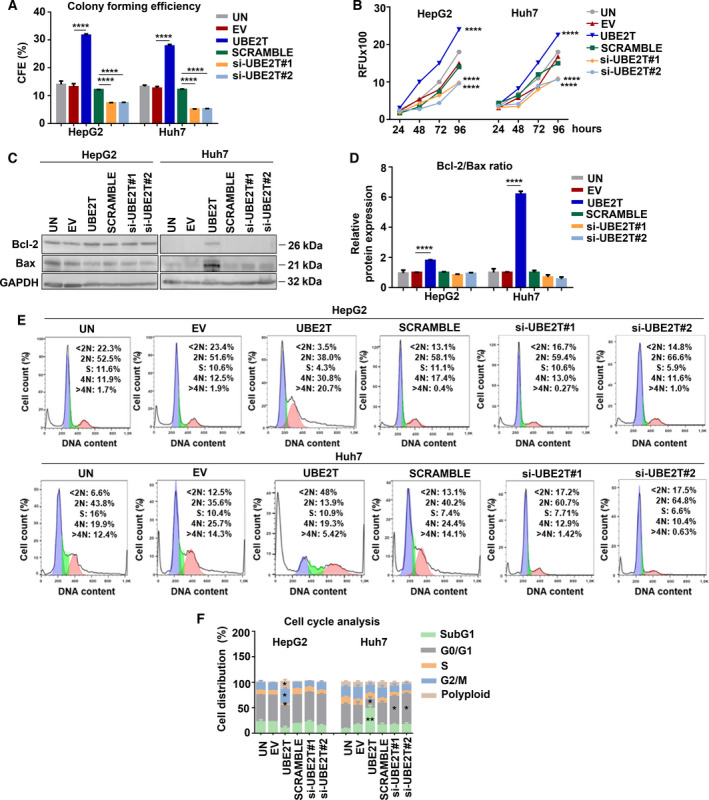
Fig. 1.

UBE2T increases the growth‐promoting traits of HCC cells. (A) Graph showing the effect of UBE2T expression on soft agar colony formation in HepG2/Huh7. (B) Alamar blue assay was performed to quantify the viability over a period of 96 h. (C) Western blot analysis for the detection of protein levels of Bcl‐2 and Bax. (D) Graph showing the Bcl‐2/Bax ratio from (C). (E) Measurement of DNA content by flow cytometry. (F) Quantification of the percentage of cells in each cell cycle phase from (E). Data shown are the mean ± SEM from n = 3 independent experiments, two‐tailed Student's t‐test (*P ≤ 0.05, **P ≤ 0.01, ****P ≤ 0.0001). Empty vector (EV)‐transfected cells were used as control for UBE2T ectopic overexpression (UBE2T), while non‐targeting siRNA (SCRAMBLE) as control for UBE2T silencing (si‐UBE2T#1, si‐UBE2T#2). Untransfected cells (UN) were used as negative control. Normalization in western blot was performed to GAPDH.
