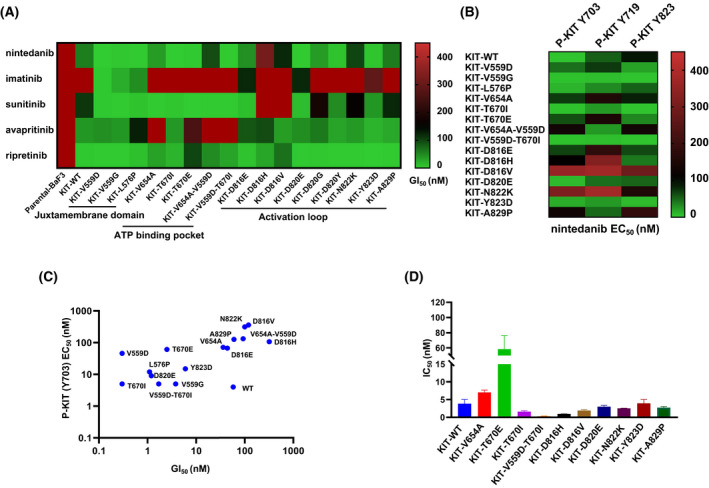
Fig. 1.

Nintedanib inhibits KIT wt and KIT mutant in vitro. (A) The heatmap shows GI50 values (growth inhibitory activity) of nintedanib, imatinib, sunitinib, avapritinib and ripretinib in BaF3 isogenic cell lines whose proliferation were depend on KIT wt and KIT mutant kinase. The cell lines were treated with drugs (0–10 μm) for 3 days (n = 3, independent experiments). (B) The heatmap shows that EC50 (effective concentrations) values was calculated by quantifying the levels of KIT Y703/Y719/Y823 relative to KIT after a various dose of nintedanib treatment for 2 h. (C) Relativity between GI50s and EC50s on KIT wt and mutants of BaF3 isogenic cell lines panel. (D) Nintedanib inhibits KIT wt and KIT mutant proteins using ADP‐Glo biochemical assay. Data are shown as mean ± SD (n = 2, independent experiments). High GI50 (EC50) and low GI50 (EC50) values were corresponded by red colour and green colour, respectively.
