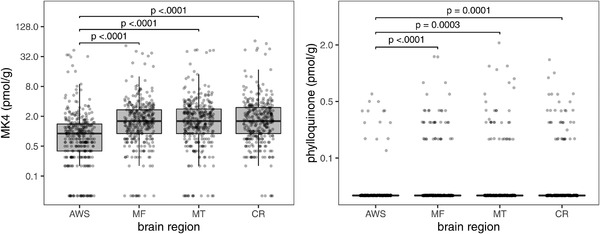
FIGURE 1.

Boxplots of menaquinone‐4 (MK4) and phylloquinone concentrations in four human brain regions (AWS, anterior watershed; MF, mid‐frontal cortex; MT, mid‐temporal cortex; CR, cerebellum) (n = 325). Boxplot indicates the median (middle line of the box), first quartile (lower boundary of the box), and third quartile (upper boundary of the box) of MK4 and phylloquinone concentrations in each brain region. Points at the bottom of each plot indicate values below detection limits (0.1 pmol/g). Brackets indicate post hoc pairwise comparison tests with Tukey adjustment that have significant P‐values
